This presentation illustrates the conductivity properties of a strong electrolyte, a weak electrolyte, and a non-electrolyte. A conductivity tester has two electrodes that are dipped into a solution. A potential difference is applied to the two electrodes. Either a direct current (DC) or alternating current (AC) can be applied to the two electrodes. If the solution supports a current (cations with a positive charge and anions with a negative charge migrating in opposite directions), then the resulting current is proportional to the conductivity of the solution. Using a simple conductivity apparatus with a light bulb, if the solution supports a current then the light bulb will light up. If the light bulb lights up there must be ions present in solution. An aqueous solution that supports a current is said to have electrolytes - cations and anions - as the solute. The solvent is water. The demonstration emphasizes the qualitative aspects of conductivity testing of solutions and concepts associated with electrolytes and the composition of solutions. The results of the demonstration are suitable enough for students to classify the solute in an aqueous solution as a strong electrolyte, weak electrolyte or non-electrolyte.
What students observe: Deionized water fails to light the light bulb in the conductivity tester. A light bulb conductivity tester does not light up at all when the electrodes are inserted into either solid granular sodium chloride, solid granular sucrose, an aqueous soluiton of sugar or ethanol. However, when solid NaCl dissolves in water, the sodium chloride solution lights the bulb brightly. A solution of KCl(aq) when test will light up a light bulb. When solid sucrose dissolves in water the sucrose solution fails to light the bulb. A 1M acetic acid solution, a weak acid, makes the bulb glow dimly.
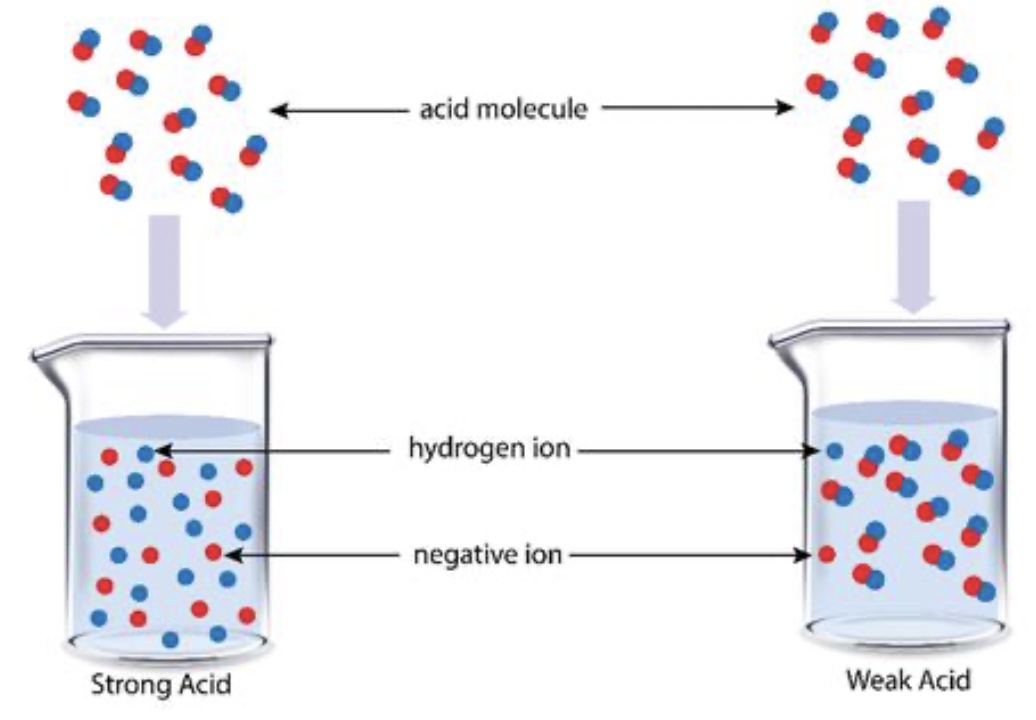
Representation of strong and weak electrolytes interacting with electrodes using particle diagrams.
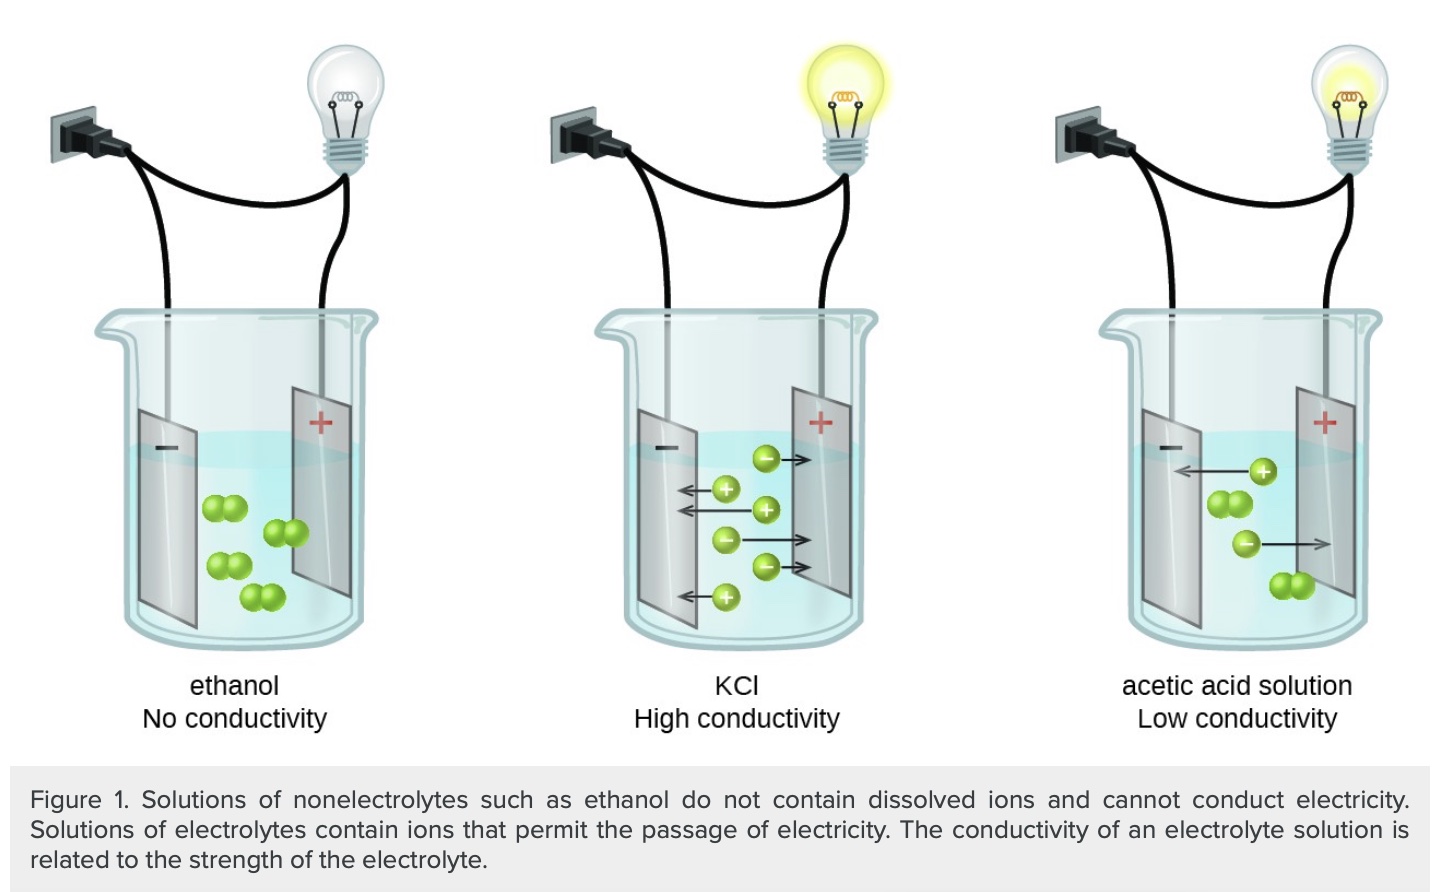
Figure source: https://opentextbc.ca/chemistry/chapter/11-2-electrolytes/
Potassium Chloride (KCl) is a strong electrolyte that completely ionizes in water. There are lots of cations and anions in a KCl(aq) solution. The solution has high conductivity. Acetic acid is a weak electrolyte that dissocaites about 5% in water, the solution mostly consists of molecules with a few ions. An acetic acid solution has low conductivity. Electrolytes consist of an equal number of cations and anions. The migration of cations and anions in opposite direction in a solution constitutes an electrical current.
The Science The conductance of an electrolyte depends on two factors: the number of ions present in a unit volume of solution and the speed at which ions move towards the electrodes (which is related to the temperature of the solution). An increase in the number of ions in solution results in an increase in specific conductivity. An increase in the temperature of a solution containing an electrolyte results in an increase in specific conductivity. There are three terms used for conductance: equivalent conductance, specific conductivity, molar conductance.
specific conductivity, K = 1/ρ unit: ohm-1 cm-1 or μSiemens per cm
This web page is under construction. Web page author: T. Greenbowe, University of Oregon
This presentation includes suggestions for visual images, student activities, computer animations of ions in solution, a computer simulation, videos, and a sample of clicker questions. A Power Point slide deck is available to download from the menu. This presentation includes all three levels of representations (Johnstone, 1982, 1991, 1993) for understanding conductivity testing and electrolytes - macroscopic level (the conductivity of solutions demonstration), the particle level (diagrams, animations), and the symbolic level (balanced chemical equations, equations from physics).
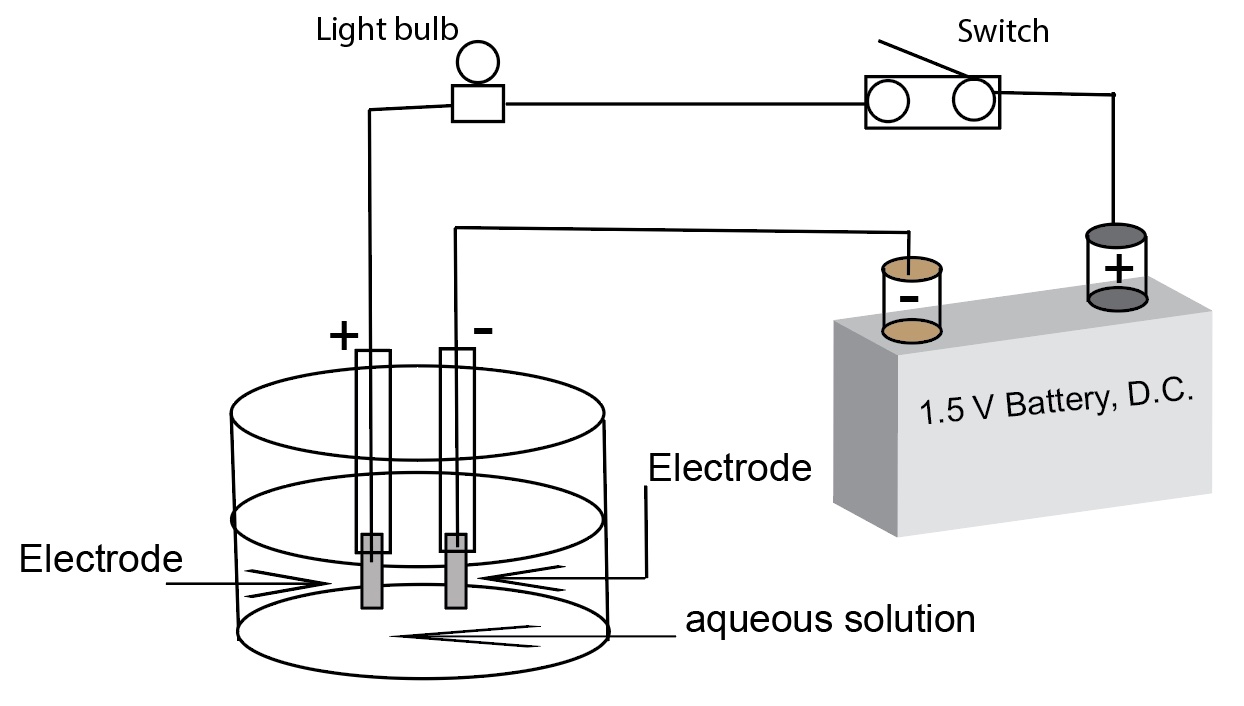
A diagram of a simple conductivity test apparatus using a battery (direct current) as the power source.
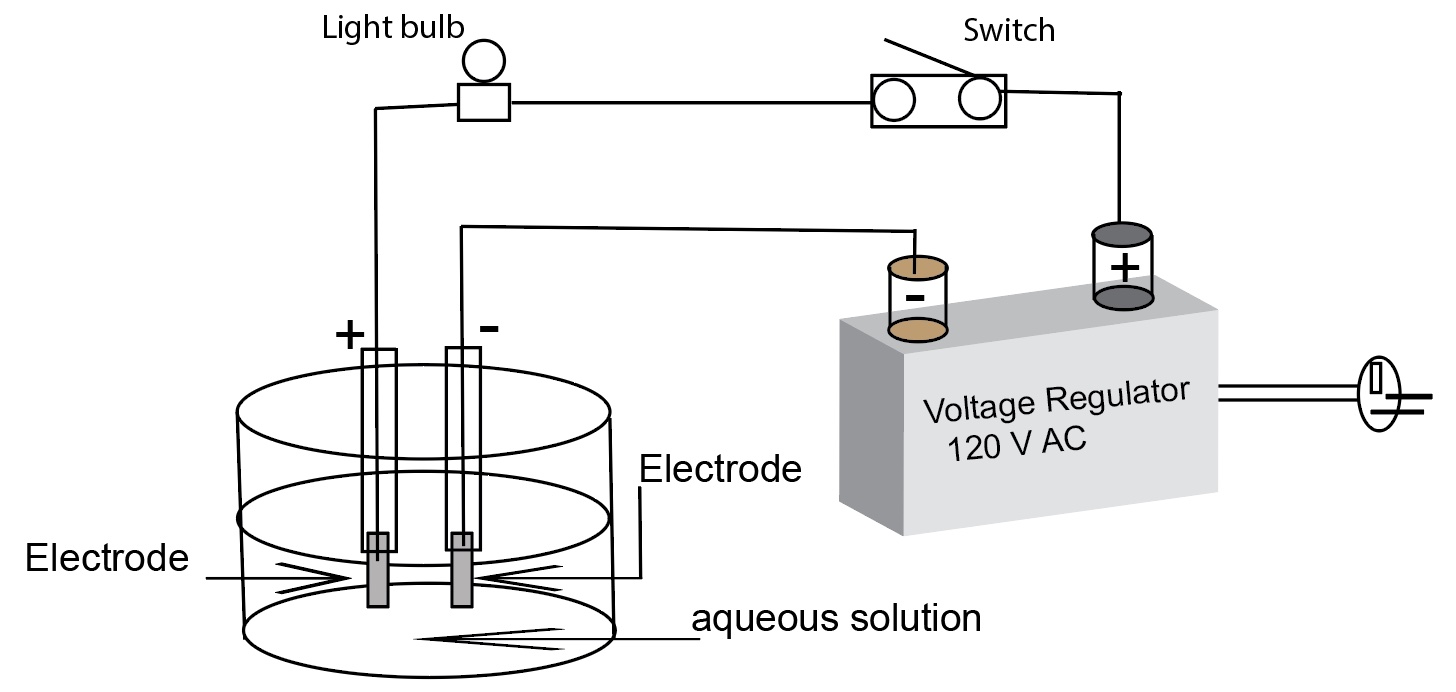
A diagram of a simple conductivity test apparatus using a voltage regulator (alternating current) as the power source.
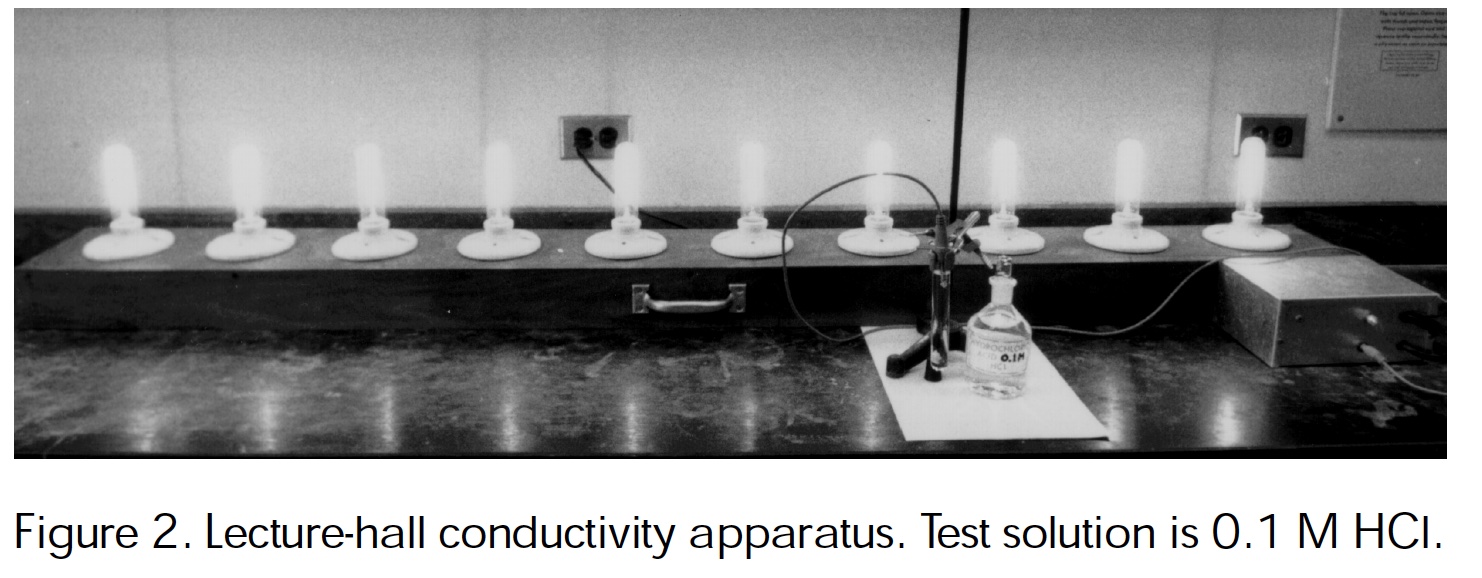
A lecture hall conductivity apparatus.Haworth, Bartlet, Kenney (1999) J. Chem Ed.
Authors of this page: Randy Sullivan and Tom Greenbowe, University of Oregon
This page is under construction.
What do students do during the demonstration? Student activity sheet A.
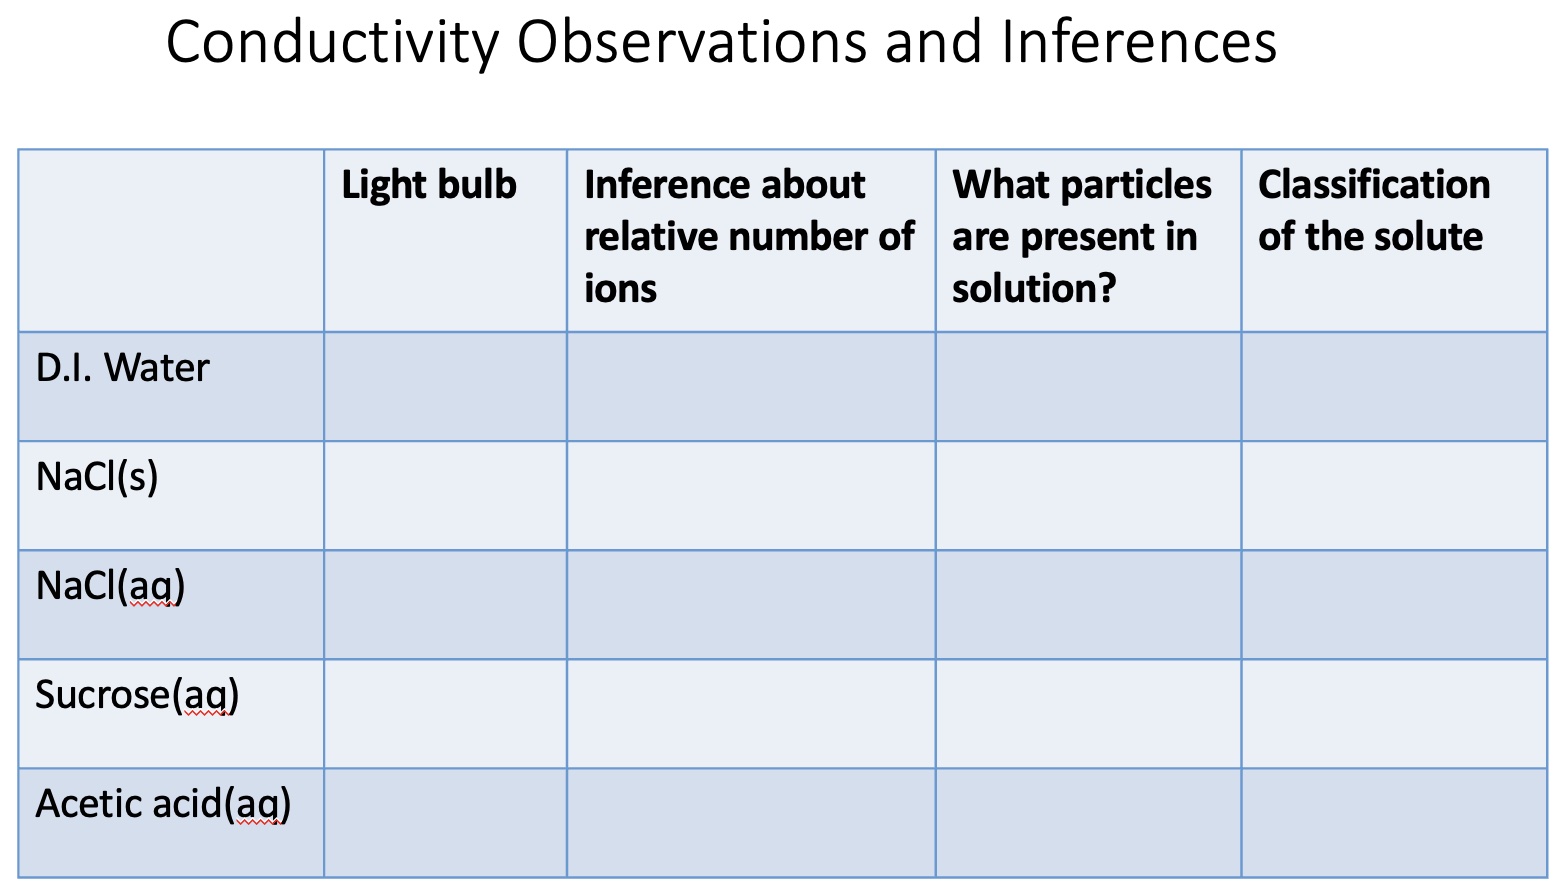
It helps if students make a simple table and fill in the table during the demonstration. Students make observations of what the light bulb is doing during the conductivity tests of solutions and make inferences as to the relative number of ions present in solution. From the name of the solutes and the inferences as to the number of ions present in the solutions, students describe what is in each of the solutions. Students draw particle level diagrams representing the relative number of ions and molecules in the solutions and compare the diagrams. Students then classify the solutes in the solutions as a strong electrolyte, weak electrolyte or non-electrolyte.
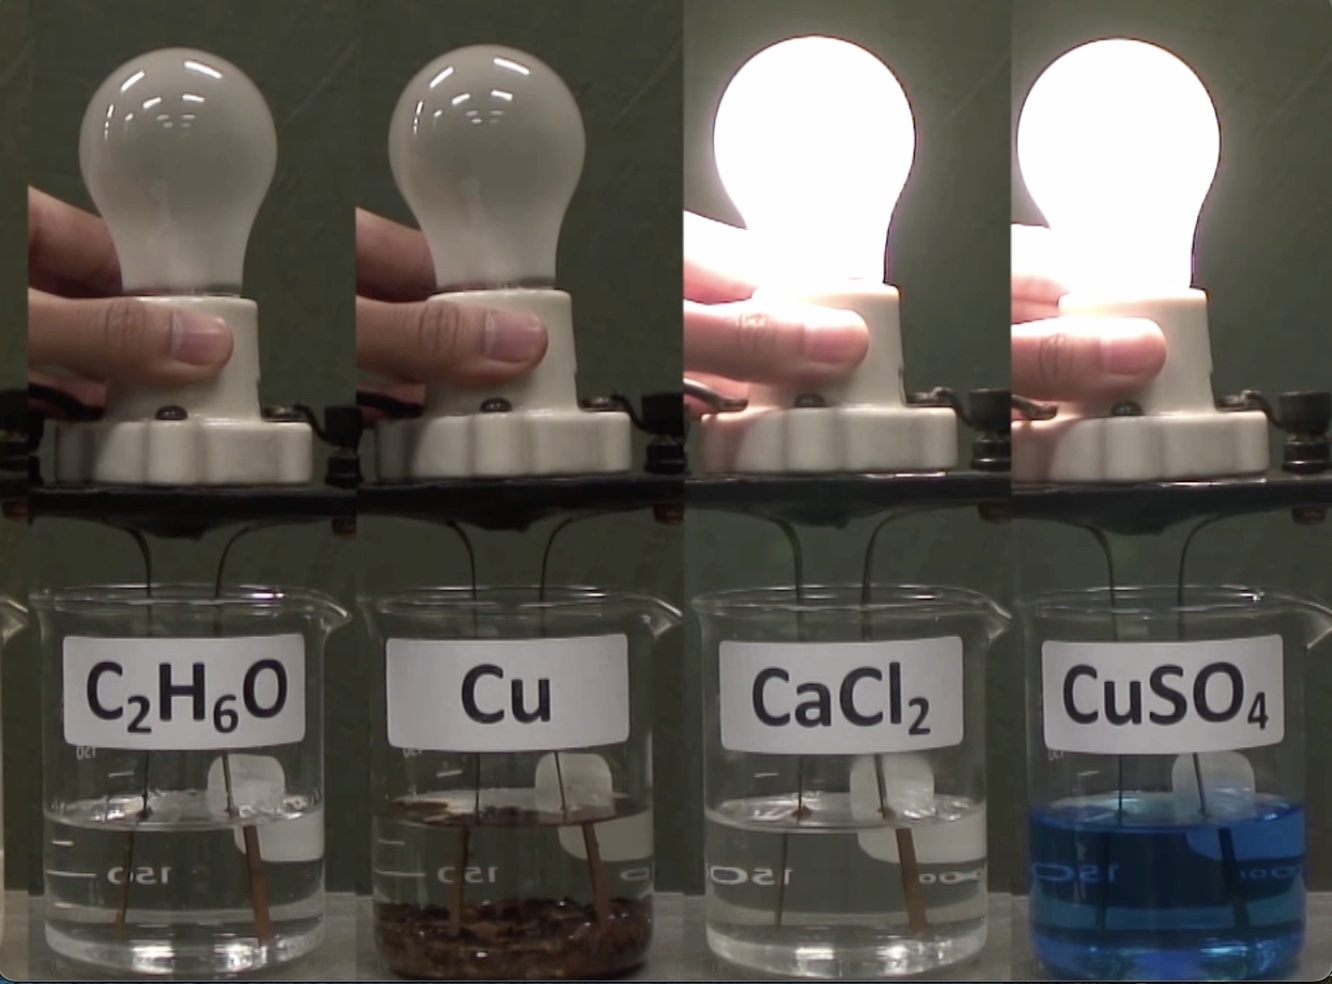
What do students observe? Sample observation of conductivity test. Image from BerkeleyChemDemo. Video URL is below.
Conductivity apparatus safety comments and cautions when using the simple apparatus connected to 120 Volts AC outlet
The person doing the demonstration (instructor or demonstrator) needs to wear a pair of rubber gloves before plugging the conductivity apparatus electrical cord into an AC electrical outlet. The gloves are kept on through out the entire experiment and while the apparatus is plugged in. The instructor or demonstrator shall wear safety googles.
To prevent electric shock, the electrodes are not to be touched while the apparatus is plugged into a 120 volts AC outlet. The apparatus is not to be left on unattended. In any demonstration involving “live” electrical contacts, the apparatus must be disconnected from the power source except when actually doing the demonstration and making observations.
Conductivity Apparatus Notes
A good conductivity apparatus is necessary for this demonstration, one that indicates more than not lit, dimly lit, and brightly lit bulb. Students grasp several concepts when the conductivity apparatus is illustrated as having a direct current battery with a positive pole and a negative pole. Students readily agree the positive cations in solution will be attracted to the negative electrode and the negative anions will be attracted to the positive electrode. However, there are problems with polarization about the electrodes within a few seconds of operation. Most simple conductivity testers , using bare wires, are plugged directly into a 120 volt AC outlet. This is a safety hazard. the Journal of Chemical Education has published several articles about homemade conductivity testers, complete with materials and circuit diagrams. All of theses provide some degree of qualitative indications (bar graphs, multiple lights) that goes beyond bright and dim and not lit categories.
An alternating current is preferred because AC prevents the build-up of ion migration to the two electrodes. During each cycle of the AC, the polarity of the electrodes is reversed, which reverses the direction of the movement of cations and anions. This prevents electrolysis (reduces the opportunity for any chemical reactions that might occur on each electrode) and polarization from happening at the electrodes.
Materials
- 1 150 mL beaker containing about 20g of NaCl
- 1 150 mL beaker containing about 20g of sucrose
- 500 mL of deionized water
- 200 mL of 1M acetic acid
- 3 400 mL beakers
- 2 stirring rods
- conductivity tester mounted on ring stand
- power strip
- wash bottle containing deionized water for rinsing electrodes
- large crystallization dish to catch rinse water
- screwdriver with insulated handle
- paper towels
Procedure
- Plug in power strip to electric outlet and plug in conductivity tester to power strip. Make sure that the power strip is turned off!
- Turn on the power strip. Short the electrodes with the blade of the screwdriver to show the students what a positive conductivity result looks like. The bulb lights up. Turn off the power strip.
- Turn on the power strip and insert the electrodes into the NaCl crystals. The bulb does not light. Turn off the power strip. Rinse and dry the electrodes.
- Turn on the power strip and insert the electrodes into the sucrose crystals. The bulb does not light. Turn off the power strip. Rinse the electrodes.
- Pour about 200 mL of deionized water into one of the 400 mL beakers. Turn on the power strip and insert the electrodes into the water. The bulb does not light. Turn off the power strip.
- Add the NaCl to the water in the beaker and stir. Turn on the power strip and insert the electrodes into the NaCl solution. The bulb lights up. Turn off the power strip. Rinse the electrodes.
- Pour about 200 mL of deionized water into one the other 400 mL beakers and add the sucrose. Stir. Turn on the power strip and insert the electrodes into the sucrose solution. The bulb does not light. Turn off the power strip. Rinse the electrodes.
- Pour about 200 mL of 1M acetic acid into the remaining 400 mL beaker. Turn on the power strip and insert the electrodes into the acetic acid solution. The bulb glows dimly. Turn off the power strip.
Physics
Microscopically, a material's resistivity (ρ) depends on the number of free particles (ions in solution or electrons in metals) available. The degree of difficulty particles experience moving through material (solution or metals) is called resistivity, ρ. The conductivity of a material (σ) is the reciprocal of its resistivity, σ = 1/ρ.
Resistance, R units ohm
Conductance is the reciprocal of the resistance 1/R ohm-1 or Siemens
Specific resistance ρ R = ρ(length/area) The resistance depends on the length and area through which current must flow.
Resistivity (or specific resistance) 1/ρ unit: ohm cm
Specific conductance K unit: ohm-1 cm-1
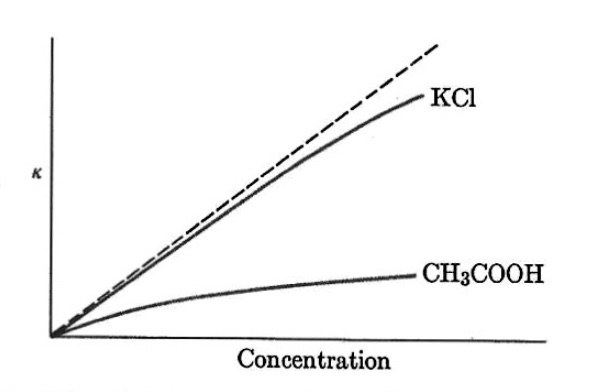
Figure. Specific conductance of aqueous potassium chloride and acetic acid as a function of concentration.
For strong electrolytes there is a correlation between specific conductance and concentration for modest concentrations. For a weak electrolyte there is considerable deviation from the expected conductance.
Equivalent conductance Λ = ( K/M ) x 1000 unit: ohm-1 cm2 equivalent-1
for 1 to 1 electrolytes such as KCk or NaBr, the equivlance conducrtance is the molar conductance
Comparison of equivalent conductance versus concentrations of a strong electrolyte KCl(aq) to a weak electrolyte (acetic acid)
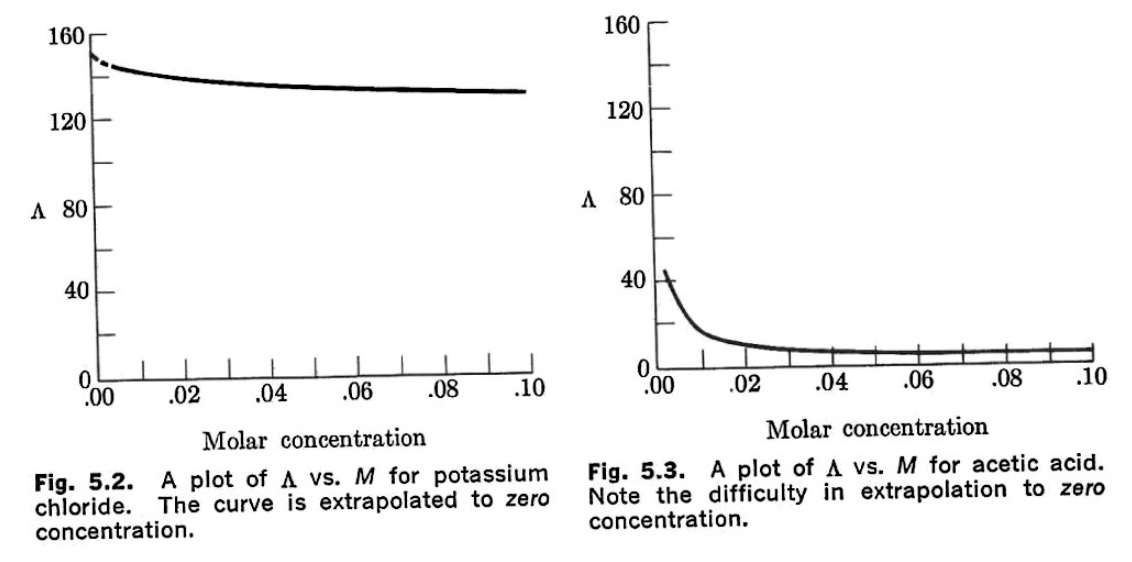
Figures from Langford and Beebe, Development of Chemical Principles
The plots indicate that equivalence conductivity per unit unit concentration decreases as the concentration increases.
Molar conductance, μ, is defined as the conductance of all ions produced by one mole of an electrolyte when dissolved in a specific volume, V, of solution.
μ = k * V units: ohm-1 cm2 mol-1 where k is a cell constant
When a direct current (DC) is used in a conductivity experiment, electrolyte solutions do not obey Ohm's Law, V = IR. V is volts.
When alternating current (AC) is used in a conductivity experiment, electrolyte solutions do obey Ohm's Law.
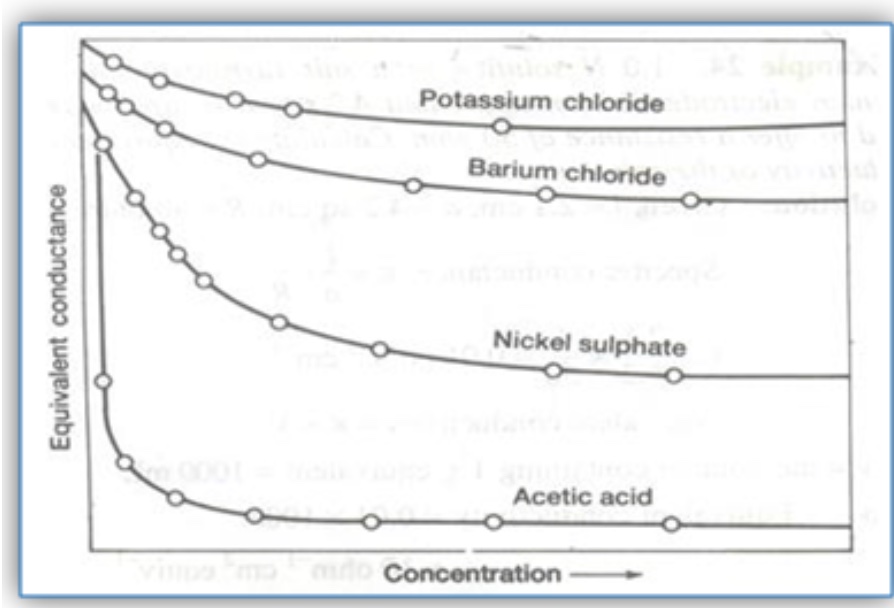
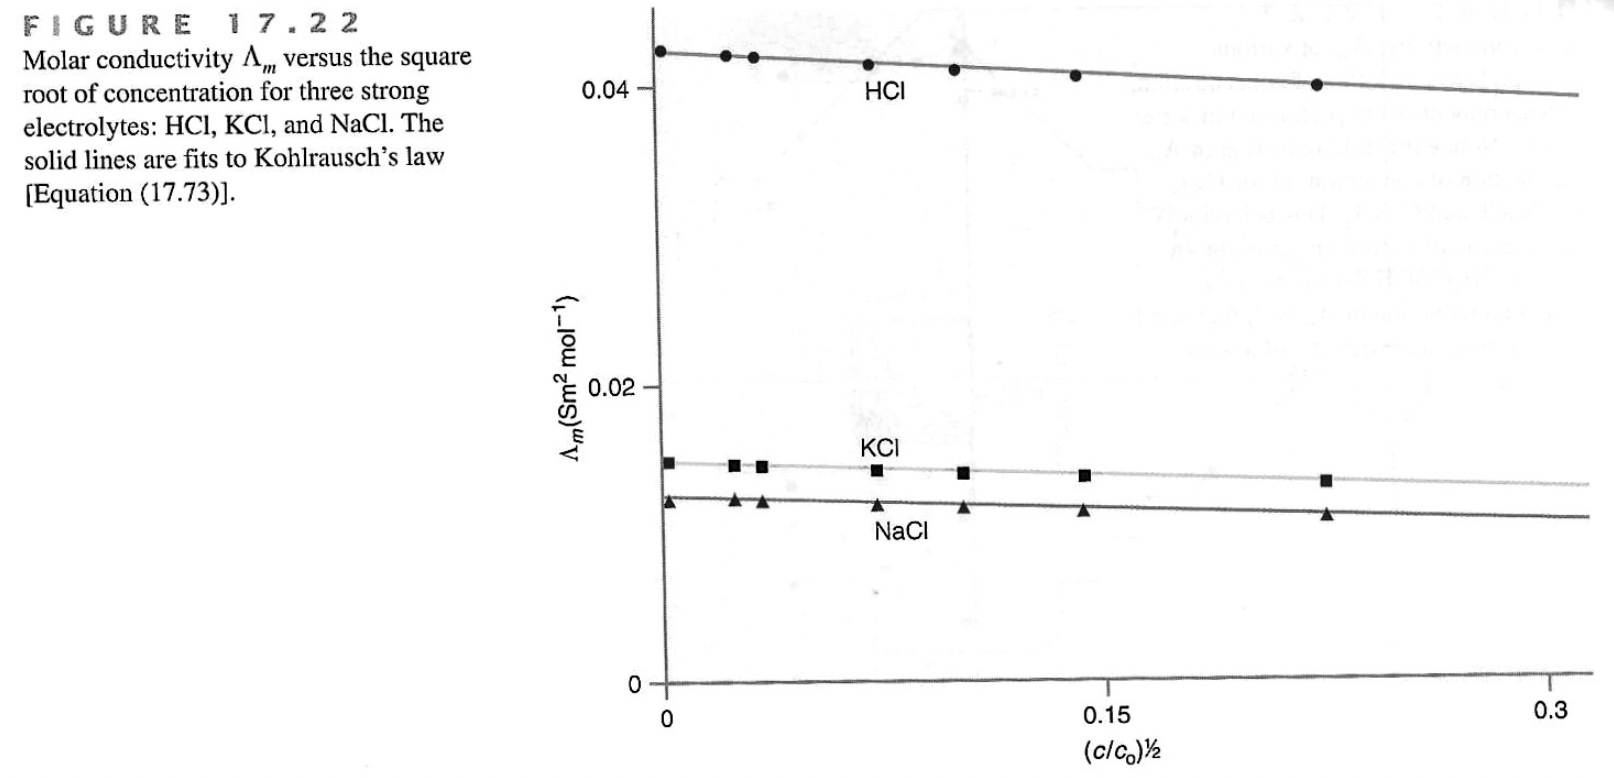
For a monovalent electrolyte, the equivalent conductance is
[equation here]
The conductivity per unit concentration decreases as the concentration increases.
k, the cell constant, is calculated by using the above equation. The same cell should be used to measure the conductivity of solutions. The cell constant applies to a measurement made in the cell with other solutions.
The determination of specific conductance of an electrolytic solution, consists of two steps:
Determination of cell constant, k, by using a standard KCl solution of known concentration in the conductivity cell.
Determination of resistance of a given solution using the same conductivity cell. The reciprocal of this gives the value of conductance.
Multiplication of conductance and cell constant gives the value of specific conductance of the solution.
In order to determine equivalent conductance or molar conductance, the concentration of the experimental solution must be known.
In conductance measurements, the solutions are prepared using deionized water which has no conductance due to dissolved impurities.
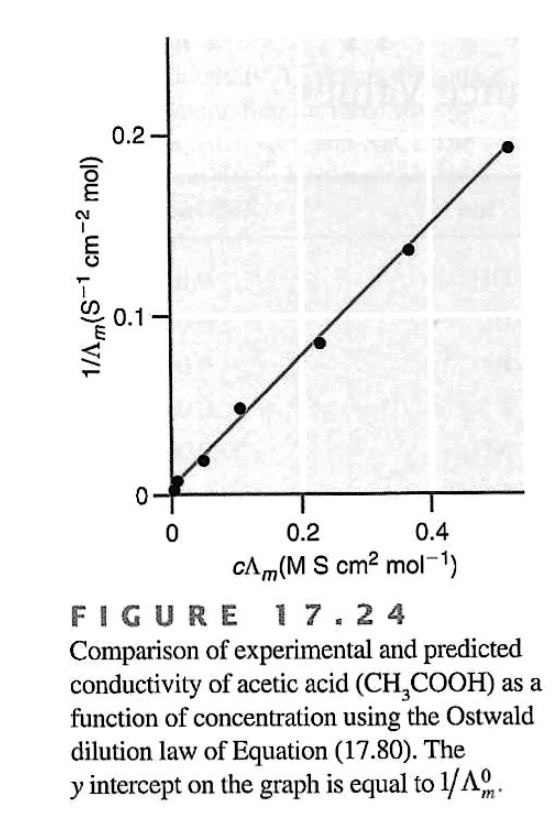
Weak electrolytes follow a different conductivity function compared to strong electrolytes. A plot of the inverse of equivalence conductivity the vesus concentration yields a direct relationship.
Curriculum Notes
This demonstration can be used to illustrate how the number of ion particles in solution classify an aqueous solution as a strong electrolyte , weak electrolyte or non-electrolyte. This demonstration can be used to help discuss topics such as the solution process, intermolecular forces, or the relative strengths of chemical bonds vs. IMF. The effectiveness of this demonstration is increased when 1) students make their own predictions, observations, and inferences; 2) draw particle level diagrams of all of the tested solutions and solids; and 3) answer questions and write explanations correlating observations from a conductivity test and composition of solutions.
There is a draft of a POGIL-like student activity that can accompany (and enhance) this demonstration.
Discussion
Substances only conduct electricity when they contain mobile charged particles. The loosely held outer shell electrons of metals are sufficiently mobile to conduct electricity, so the screwdriver tests positive for conductivity. Sodium chloride contains both sodium and chloride ions, but in the solid state they are locked in place in the crystal lattice and are therefore unavailable to conduct electricity. But when sodium chloride is dissolved in water, the crystal lattice is disrupted, and the solvated cations and anions are free to move in the solution. Using a simple representation, the electrodes are connected to a direct current battery. One electrode is connected to the positive terminal of the battery. The other electrode is connected to the negative terminal of the battery. The positively charged cations in solution are attracted to the negatively charged electrode. The negatively charged anions in solution are attracted to the positively charged electrode. Cations and anions migrating in opposite directions constitutes a current. The circuit in the conductivity apparatus will conduct electricity when ions are free to move in an aqueous solution. Sodium chloride dissolves in water to form an aqueous solution, NaCl(aq), which strongly conducts electricity. The NaCl is solution is called a strong electrolyte. Solutions having lots of ions will light the light bulb brightly.
All of the bonds in the sucrose molecule are strong covalent bonds. Therefore, there are no charged particles present to conduct electricity either in the solid state or in solution. Substances like sucrose which do not conduct electricity in aqueous solution are called non-electrolytes.
Acetic acid is a carboxylic acid having an acidic hydrogen bonded to an oxygen atom. There are other hydrogen atoms in acetic acid, but these are bonded to carbon atoms. The hydrogen atom of acetic acid that is bonded to an oxygen atom is loosely bonded. Therefore, when placed in water, polar water molecules occasionally detach a partial positively charged hydrogen ion from the rest of the molecule creating a pair of ions, hydronium ion and the acetate ion. The acetate ion is resonance stabilized.
[chemical equation here]
Since only a small percentage of the acetic acid molecules exist in the dissociated state at any given time, acetic acid solutions only conduct electricity weakly. Substances like acetic acid which weakly conduct electricity in aqueous solution are called weak electrolytes. Solutions having only a few ions will light the light bulb dimly.
A conductivity probe can be used to measure the conductance of electrolytic solutions. A high conductance corresponds to many total ion particles (cations and anions) in the solution. If a solution is comprised of molecules, for example sugar, the solution will not conduct.
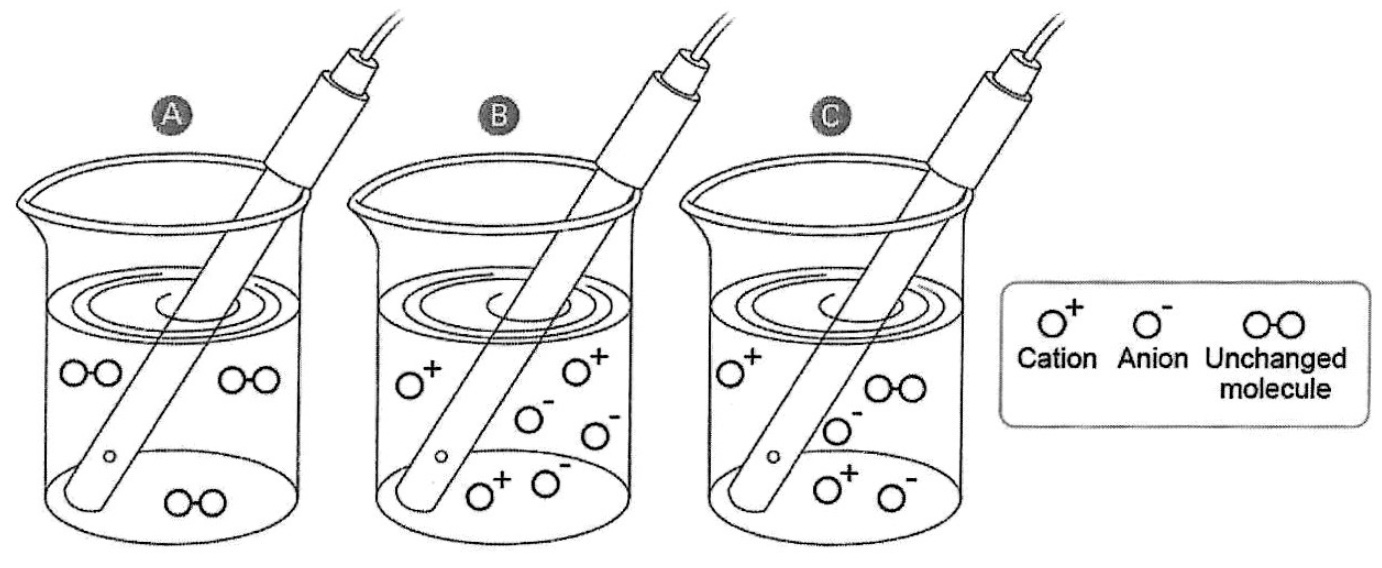
Figure from Advanced Chemistry Through Inquiry, (2015). Pasco Scientific: Roseville, CA.
Chemistry Connections
A computer simulation representing the conductivity of solutions experiment with a light bulb can accompany this demonstration or it can be used as a before, during or after class activity.
[URL to appear here]
A short computer animation of the migration of Na+ ions and Cl- ions in opposite directions during a conductivity test should accompany this demonstration in order to drive home the point that cations and anions migrating in opposite directions in a solution constitutes a current.
https://www.youtube.com/watch?v=hhGVhLLXRzM
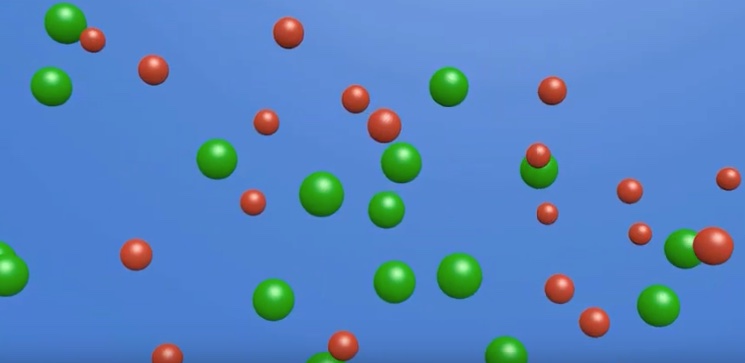
Target concepts: During a conductivity test, the electrodes have opposite charges. Cations migrate toward the negative charged electrode. Anions migrate toward the positive charged electrode. Cations and anions migrating in opposite directions in a solution constitutes a current. During a conductivity test, electrons do not enter or move through the solution.
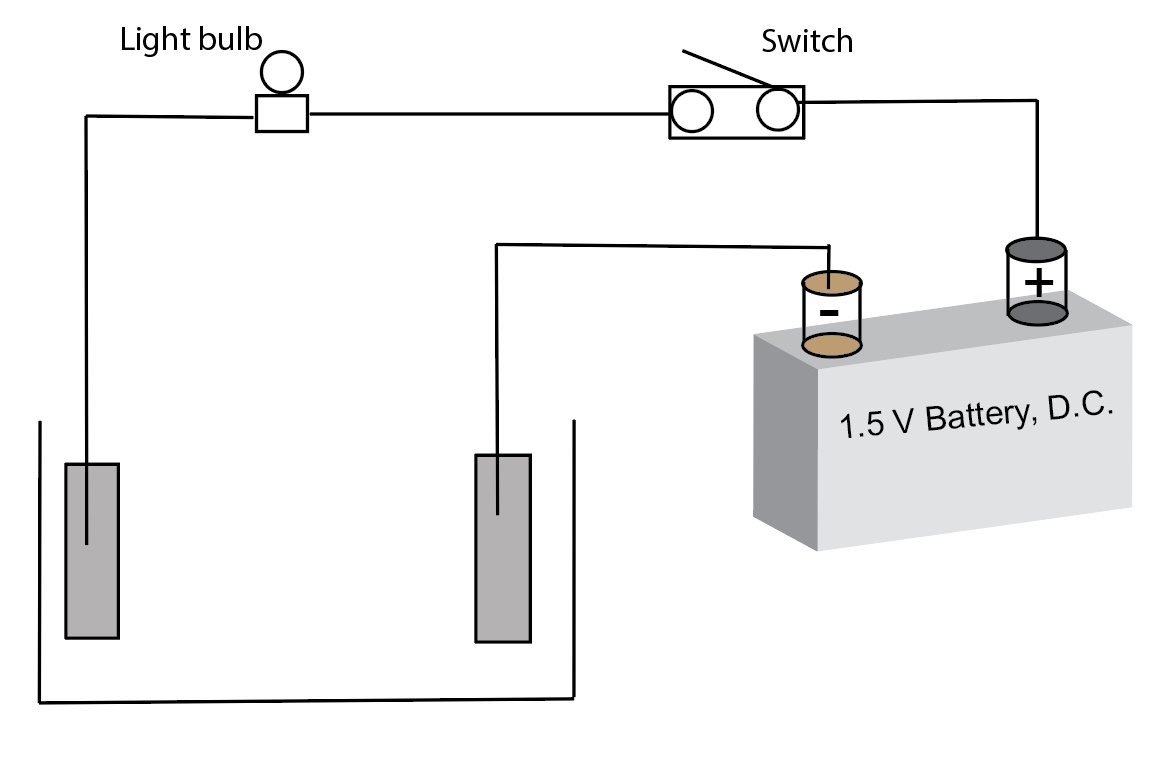
Representation, at the particle level, of the movement of cations and anions towards the electrodes
Computer animation of Na+ cation migrating toward the negative electrode of the conductivity test apparatus.
https://www.youtube.com/watch?v=ZgcGzdf2zhw
Computer animation of Cl- anion migrating toward the positive electrode of the conductivity test apparatus.
https://www.youtube.com/watch?v=f0WMu3wJLAQ
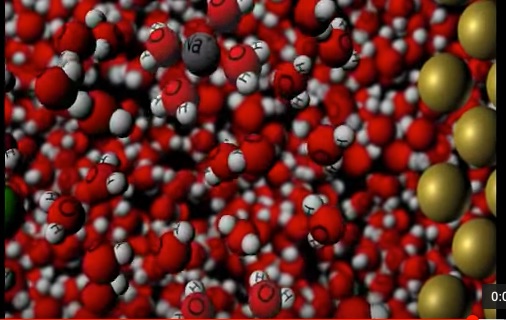
Student Activity Sheet B. Conductivity Cell Diagram. Students complete this diagram while participating in the presentation. Students draw a particle diagram of the relative number and types of ions and or molecules present in solution. Students indicate on the diagram a) the relative charge of each electrode, (b) the direction of cation movement, (c) the direction of anion movement between the electrodes.
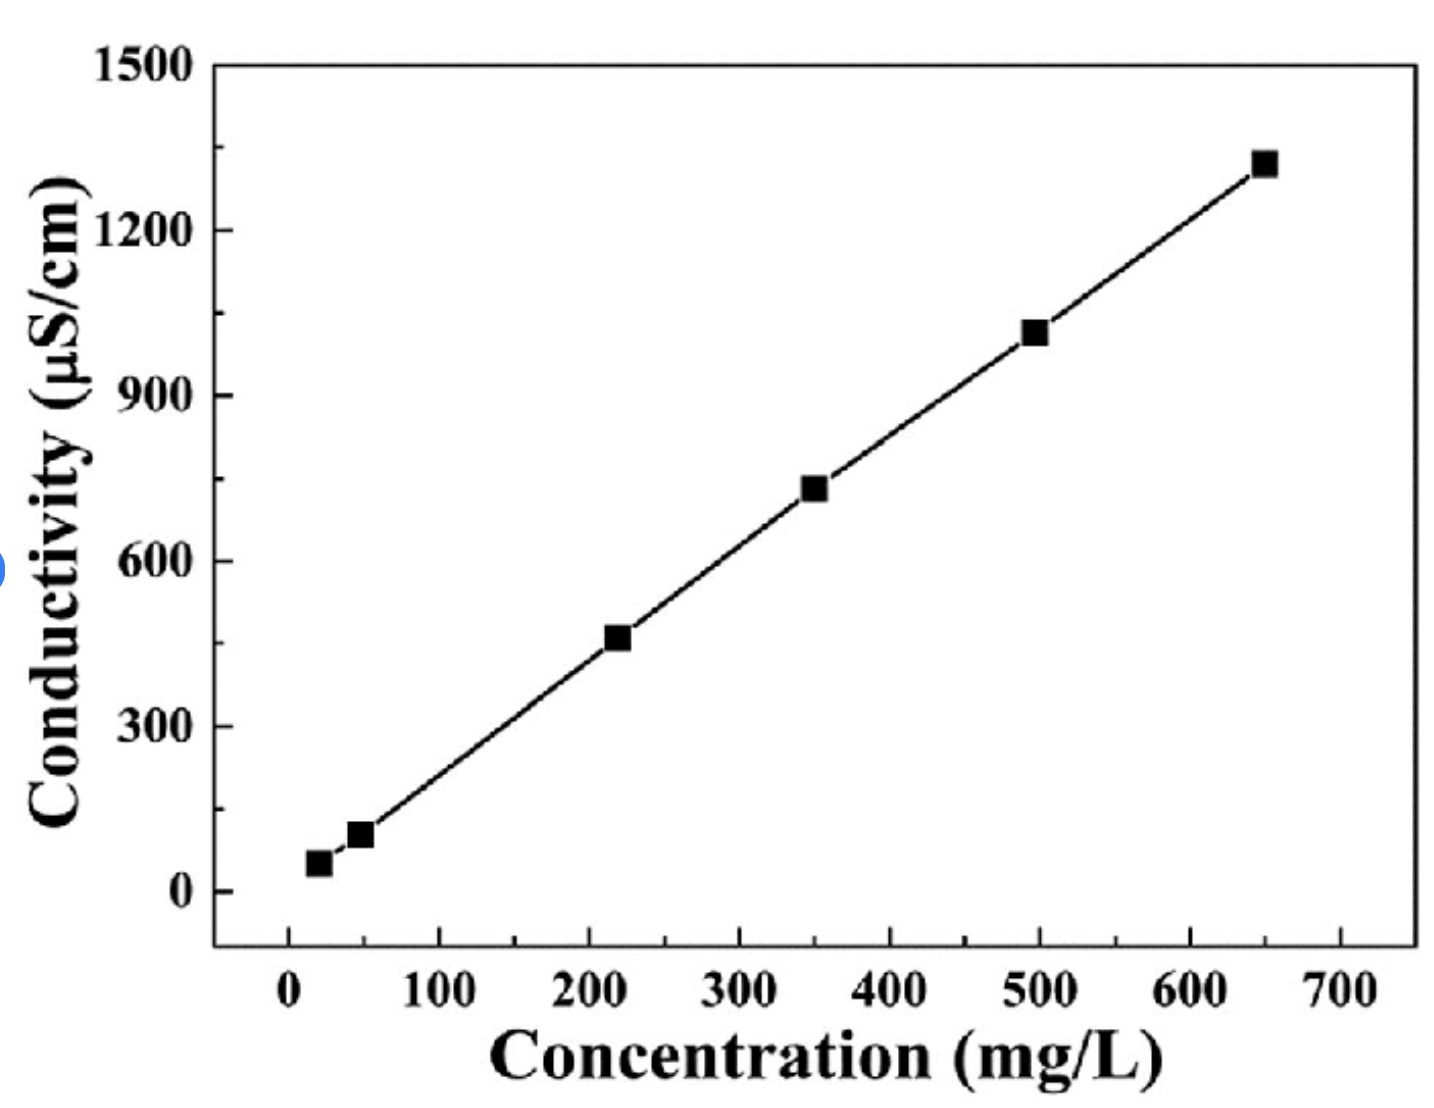
Direct Proportional Linear Relationship (nearly so) between conductivity and concentration.
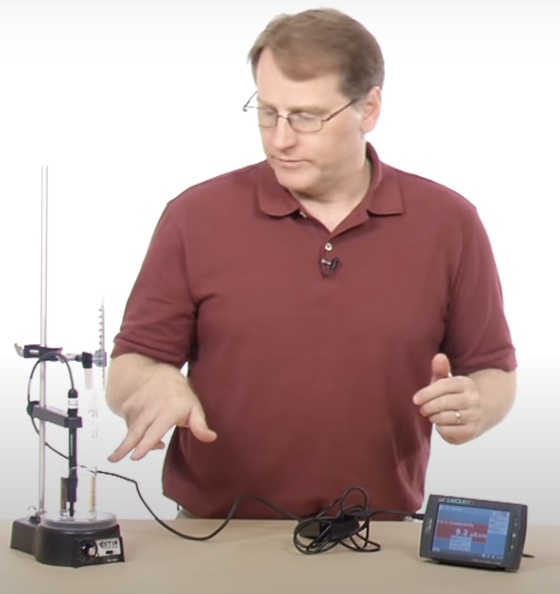 | 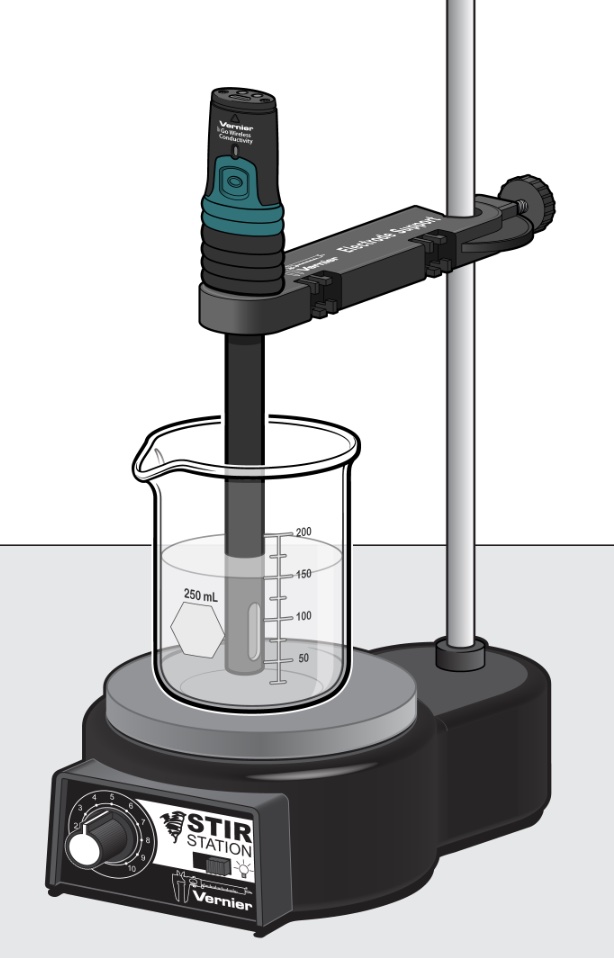 |
A scientific conductivity probe (i.e. Vernier, CON-BTA or Go-Pro Conductivity) measures solution conductivity in units of microSiemens per centimeter. Solution concentration or total ion concentration can be determined. A data table lists the concentration of several NaCl solutions (mg/L), Total dissolved solids (mg/L) and measured conductivity of the solution, uS/cm) - Vernier - Conductivity Probe Manual, Beaverton, Oregon.
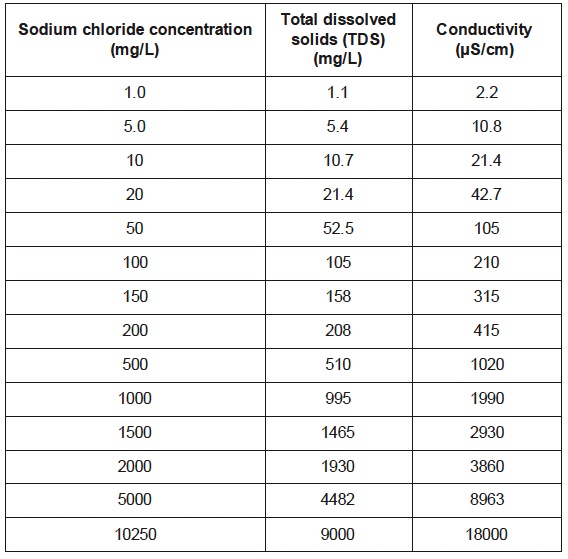
A plot of conductivity versus total dissolved solids (TDS) concentration for NaCl(aq) indicates a direct proportional relation.
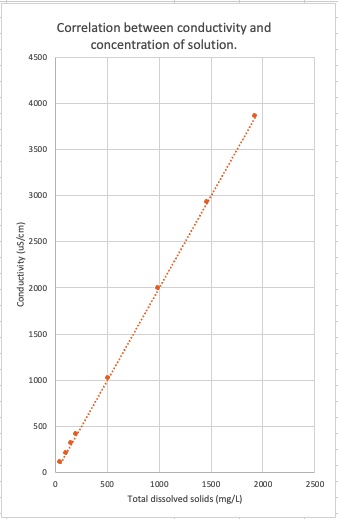
The concentration of ions in an aqueous solution can be determined. For example, the graph above shows a 2:1 ratio between conductivity and TDS - the slope of the line is 2:1 - for an NaCl solution. For each one unit of NaCl there are two ions, Na+ and Cl-. A 1020 uS/cm conductivity measurement of an NaCl solution corresponds to 500 mg/L of NaCl solution, which is 250 mg/L of Na+(aq) and 250 mg/L of Cl-(aq).
Target Concept: Lots of ions in solution corresponds to a high conductivity measurement. Few ions in solution corresponds to a low conductivity measurement. There is a linear relationship between conductivity and concentration of cations and anions in solution.
Additional Solutions may be tested. Video of lecture demonstration of conductivity test of aqueous solutions - video from BerkeleyChemDemos.
Physical chemistry lecture of ions in solution and electrolytes
This demonstration can be used to illustrate how the number of ion particles in solution classify an aqueous solution as a strong electrolyte , weak electrolyte or non-electrolyte. This demonstration can be used to help discuss topics such as the solution process, intermolecular forces, or the relative strengths of chemical bonds vs. IMF. The effectiveness of this demonstration is increased when 1) students make their own predictions, observations, and inferences; 2) draw particle level diagrams of all of the tested solutions and solids; and 3) answer questions and write explanations about solutions.
Learning Objectives
1. Explain why water is a polar molecule and how five or six water molecules interact with substances to participate in the dissolving process.
2. From physics, apply the concepts of "unlike charges attract", dipole moment, and vectors to help explain why polar substances and soluble ionic substances dissolve in water to generate ions.
3. Categorize an aqueous solution as being a strong electrolyte, weak electrolyte, or non-electrolyte, based on the results of a conductivity test.
4. Represent aqueous ionic solutions and aqueous polar covalent solutions (strong electrolytes, weak electrolytes, and non-electrolytes) using particle level diagrams.
5. Relate the results of a conductivity test to the relative number of ions in solution.
6. For an aqueous solution undergoing a conductivity test, explain how the movement of cations and anions in opposite direction in a solution, constitutes a electrical current.
7. For an aqueous solution undergoing a conductivity test, explain why cations move toward the negative electrode and why anions move toward the positive electrode.
8. Categorize an aqueous solution as a strong electrolyte, weak electrolyte, and non-electrolyte solutions, based on the results of a conductivity test.
9. Clearly illustrate and explain the distinctions among strong electrolyte, weak electrolyte, and non-electrolyte solutions.
10. Identify weak acids, strong acids, weak bases, and strong bases based on chemical structure (Lewis structure, name of compound).
11. During a conductivity test of an aqueous solution, explain why electrons do not move through an aqueous solution.
References
Adadan, Emine and Savasci, Funda (2012) An analysis of 16–17-year-old students' understanding of solution chemistry concepts using a two-tier diagnostic instrument,
International Journal of Science Education, 34:4, 513-544, DOI: 10.1080/09500693.2011.636084
Burke, K. A., Greenbowe, T. J., & Windschitl, M. A. (1998). Developing and using conceptual computer animations for chemistry instruction. Journal of Chemical Education, 75(12), 1658. https://doi.org/10.1021/ed075p1658
Calik, M. (2005). A cross-age study of different perspectives in solution chemistry from junior to senior high school. International Journal of Science and Mathematics Education, 3(4), 671–696.
Calik, M., & Ayas, A. (2005). A cross-age study on the understanding of chemical solutions and their components. International Education Journal, 6(1), 30–41.
Devetak, I., Vogrinc, J., & Glaar, S.A. (2009). Assessing 16-year-old students’ understanding of aqueous solution at submicroscopic level. Research in Science Education, 39(2), 157–179.
Johnstone, A. H. (1982). Macro- and micro-chemistry. School Science Review, 64, 377–379.
Johnstone, A. H. (1991). “Why is science difficult to learn? Things are seldom what they seem,” J. Computer Assisted Learn. x7(2), 75–83.
Johnstone, A. H. (1993). The development of chemistry teaching: A changing response to changing demand. Journal of Chemical Education, 70(9), 701. https://doi.org/10.1021/ed070p701
Langford, C.H., Beebe, R. A. (1995). The Development of Chemical Principles. Dover Publication, NY.
Pinarbasi, T., & Canpolat, N. (2003). Pre-service teacher trainees’ understanding of solution chemistry concepts. Journal of Chemical Education, 80(11), 1328–1332.
Pinarbasi, T., Canpolat, N., Bayrakceken, S., & Geban, O. (2006). An investigation of effectiveness of conceptual change text-oriented instruction on students’ understanding of solution concepts. Research in Science Education, 36(4), 313–335.
RUSSELL, J. W., KOZMA, R. B., JONES, T., WYKOFF, J., MARX, N. and DAVIS, J. (1997). Use of simultaneous-synchronised macroscopic, microscopic and symbolic representations to enhance the teaching and learning of chemical concepts. Journal of Chemical Education, 74, 330–334.
Talanquer, V. (2011). Macro, submicro, and symbolic: The many faces of the chemistry ‘triplet’. International Journal of Science Education, 33(2), 179–195.
Tasker, R., & Dalton, R. (2006). Research into practice: Visualisation of the molecular world using animations. Chemistry Education Research and Practice, 7(2), 141-159. https://doi.org/10.1039/b5rp90020d
Tasker, R., & Dalton, R. (2008). Visualizing the molecular world-Design, evaluation, and use of amimations. In J. K. Gilbert, M. Reiner, & M. Nakhlel (Eds.) Visualization:Theory and practice in Science Education (Models and Modeling in Science Education, Vol. 30, (pp. 103 – 132) Springer. https://doi.org/10.1007/978-1-4020-5267-5_6
Treagust, D.F., Chittleborough, G., & Mamiala, T.L. (2003). The role of submicroscopic and symbolic representations in chemical explanations. International Journal of Science Education, 25(11), 1353–1368.
Uzuntiryaki, E., & Geban, O. (2005). Effect of conceptual change approach accompanied with concept mapping on understanding of solution concepts. Instructional Science, 33, 311–339.
ChemEdX Exchange Electrical conductivity of a weak electrolyte animation
