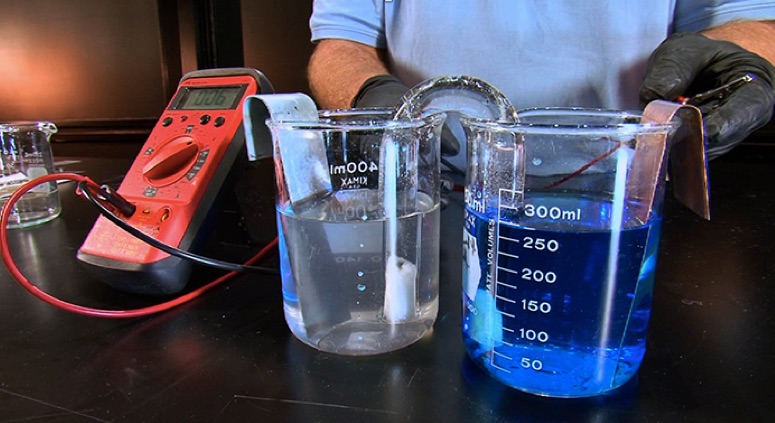
In this interactive activity, the instructor demonstrates several aspects of galvanic cells using real electrochemical cells and a computer simulation. Students view an operating zinc-copper galvanic cell with a voltmeter measuring a voltage of +1.10 Volts. The salt bridge is taken out of the cell, the voltage drops to zero. When placed back into the cell, the voltage returns to +1.10 V. Students view and or interact with a Voltaic cell simulation (AACT, 2020) including animations of the dynamic processes occurring simultaneously at the zinc anode, copper cathode, in the aqueous Zn2+ and Cu2+ solutions, the NaNO3(aq, saturated) solution in the salt bridge.
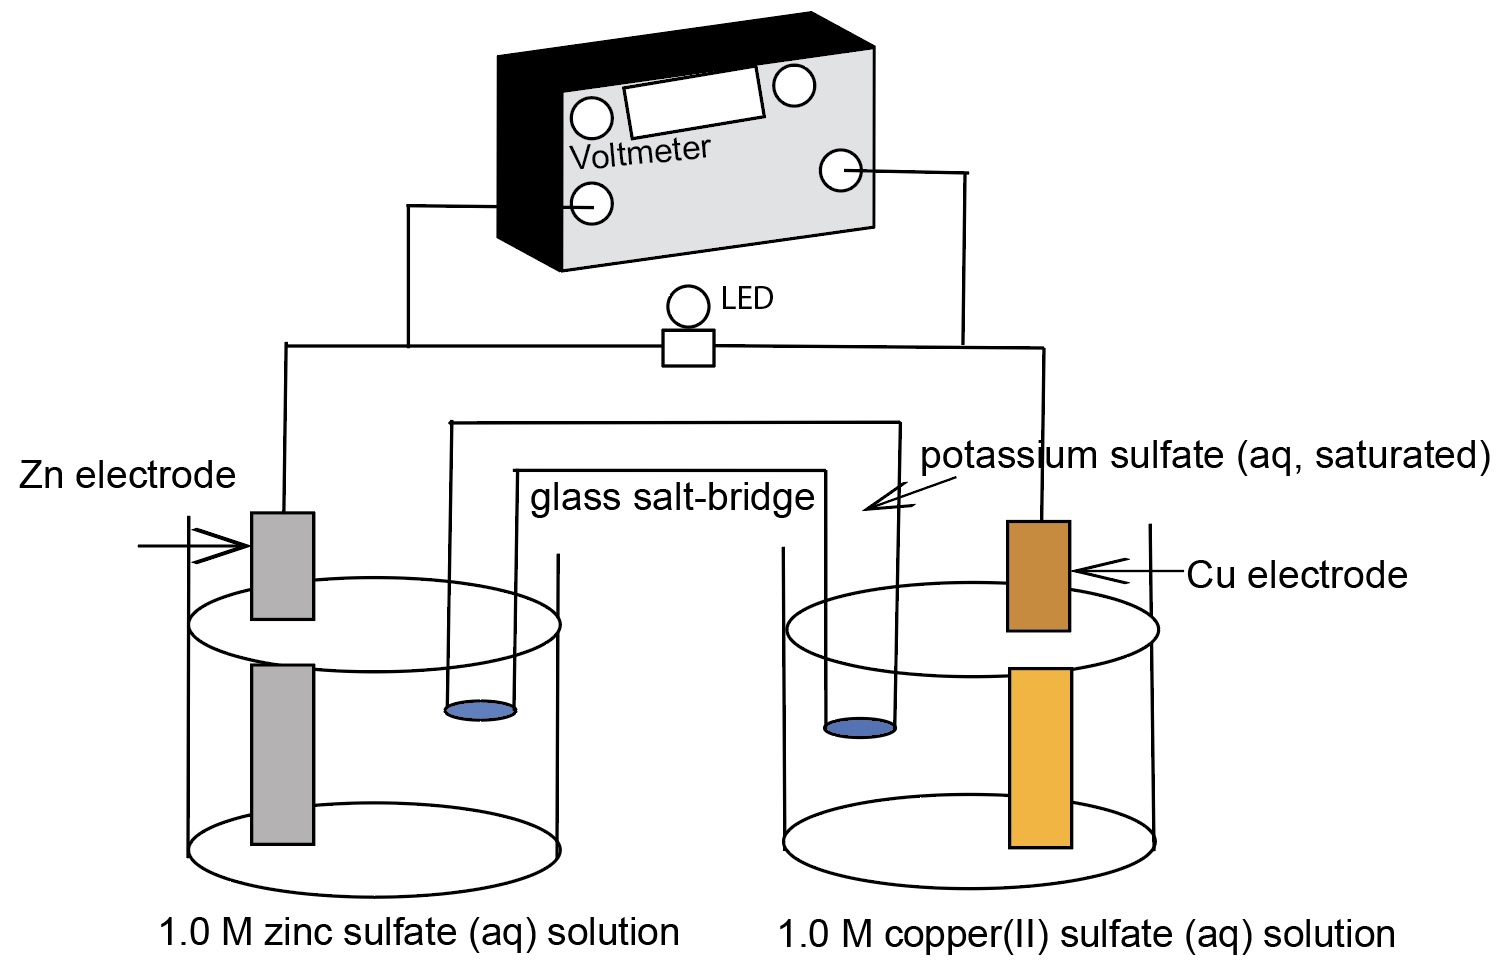
A standard cell comprising of two half-cells: zinc metal electrode in 1.0 M ZnSO4 solution, a copper metal electrode in a 1.0 M CuSO4 solution, and a connecting salt bridge.
The cell reaction is Zn(s) + Cu2+(aq) --> Zn2+(aq) + Cu(s) E°cell = +1.10 Volts.
The standard cell potential, E°cell, is the standard reduction potential of the cathode reaction, minus the standard reduction potential of the anode reaction:
E°cell = E°cathode (as a reduction potential) - E°Anode (as a reduction potential) = +0.34 V - (-0.767 V)=+ 1.10 V
  | |
ACS AACT voltaic cell computer simulation. Greenbowe, T.J.; Gelder, J.I., Boyd, A, Wixon, M. (2020). Galvanic/Voltaic Cells 1. American Chemical Society, American Association of Chemistry Teachers, Washington, D.C. https://teachchemistry.org/classroom-resources/voltaic-cells (accessed April, 2023).
If you use the simulation, cite the simulation. This simulation may not be used to support a for profit instructional lesson.
Web page Author: T. Greenbowe, University of Oregon. This page is under construction.
- 2 ea. 400 mL beakers, one containing a strip of zinc metal partially immersed in a 1.0 M ZnSO4 solution, the other containing a strip of copper metal partially immersed in a 1.0 M CuSO4 solution.
- a salt bridge comprising a U-tube filled with 2 M KNO3 solution or 2 M K2SO4(aq, sat'd.). The ends of the U-Tube should be tightly plugged with cotton that has been saturated in the KNO3 solution or the U-tube has sintered frits at each end.
- a Vernier voltage probe.
- a Vernier "Go Link" interface.
- an empty 250 mL beaker to hold the salt bridge upright when not in use.
- a computer with the Vernier "Logger Lite" program that is capable of projecting the screen image.
Optional Materials (available)
- Blank Electrochemical Cell Diagram
- POGIL Electrochemical Cell Activity or POGIL-ish Electrochemical Cell Activity Sheet
- Power Point Presentation
- Clicker Questions
- Place the two beakers side by side.
- Connect the probe leads to the metal strips where they stick up above the surface of the solutions.
- Place the salt bridge upside down so that one arm is in each of the solutions.
- Students should note that no voltage registers until the salt bridge is inserted into the solutions.
- Always wear goggles when performing chemistry demonstrations.
- Gloves should be worn to protect your hands from the solutions.
This presentation/lesson is consistent with the principles of Universal Design for learning in that multiple representations are incorporated in the presentation. This presentation also provides an opportunity for students to make connections among the macroscopic, particle level, and symbolic levels of representation (Johnstone, 1982, 1991, 1993) associated with electrochemical cell processes. The AACT simulation has particle level animations of what occurs at the surface of the electrodes, migration of ions in the aqueous solution, oxidation and reduction half-reactions, and migration of ions in the salt bridge.
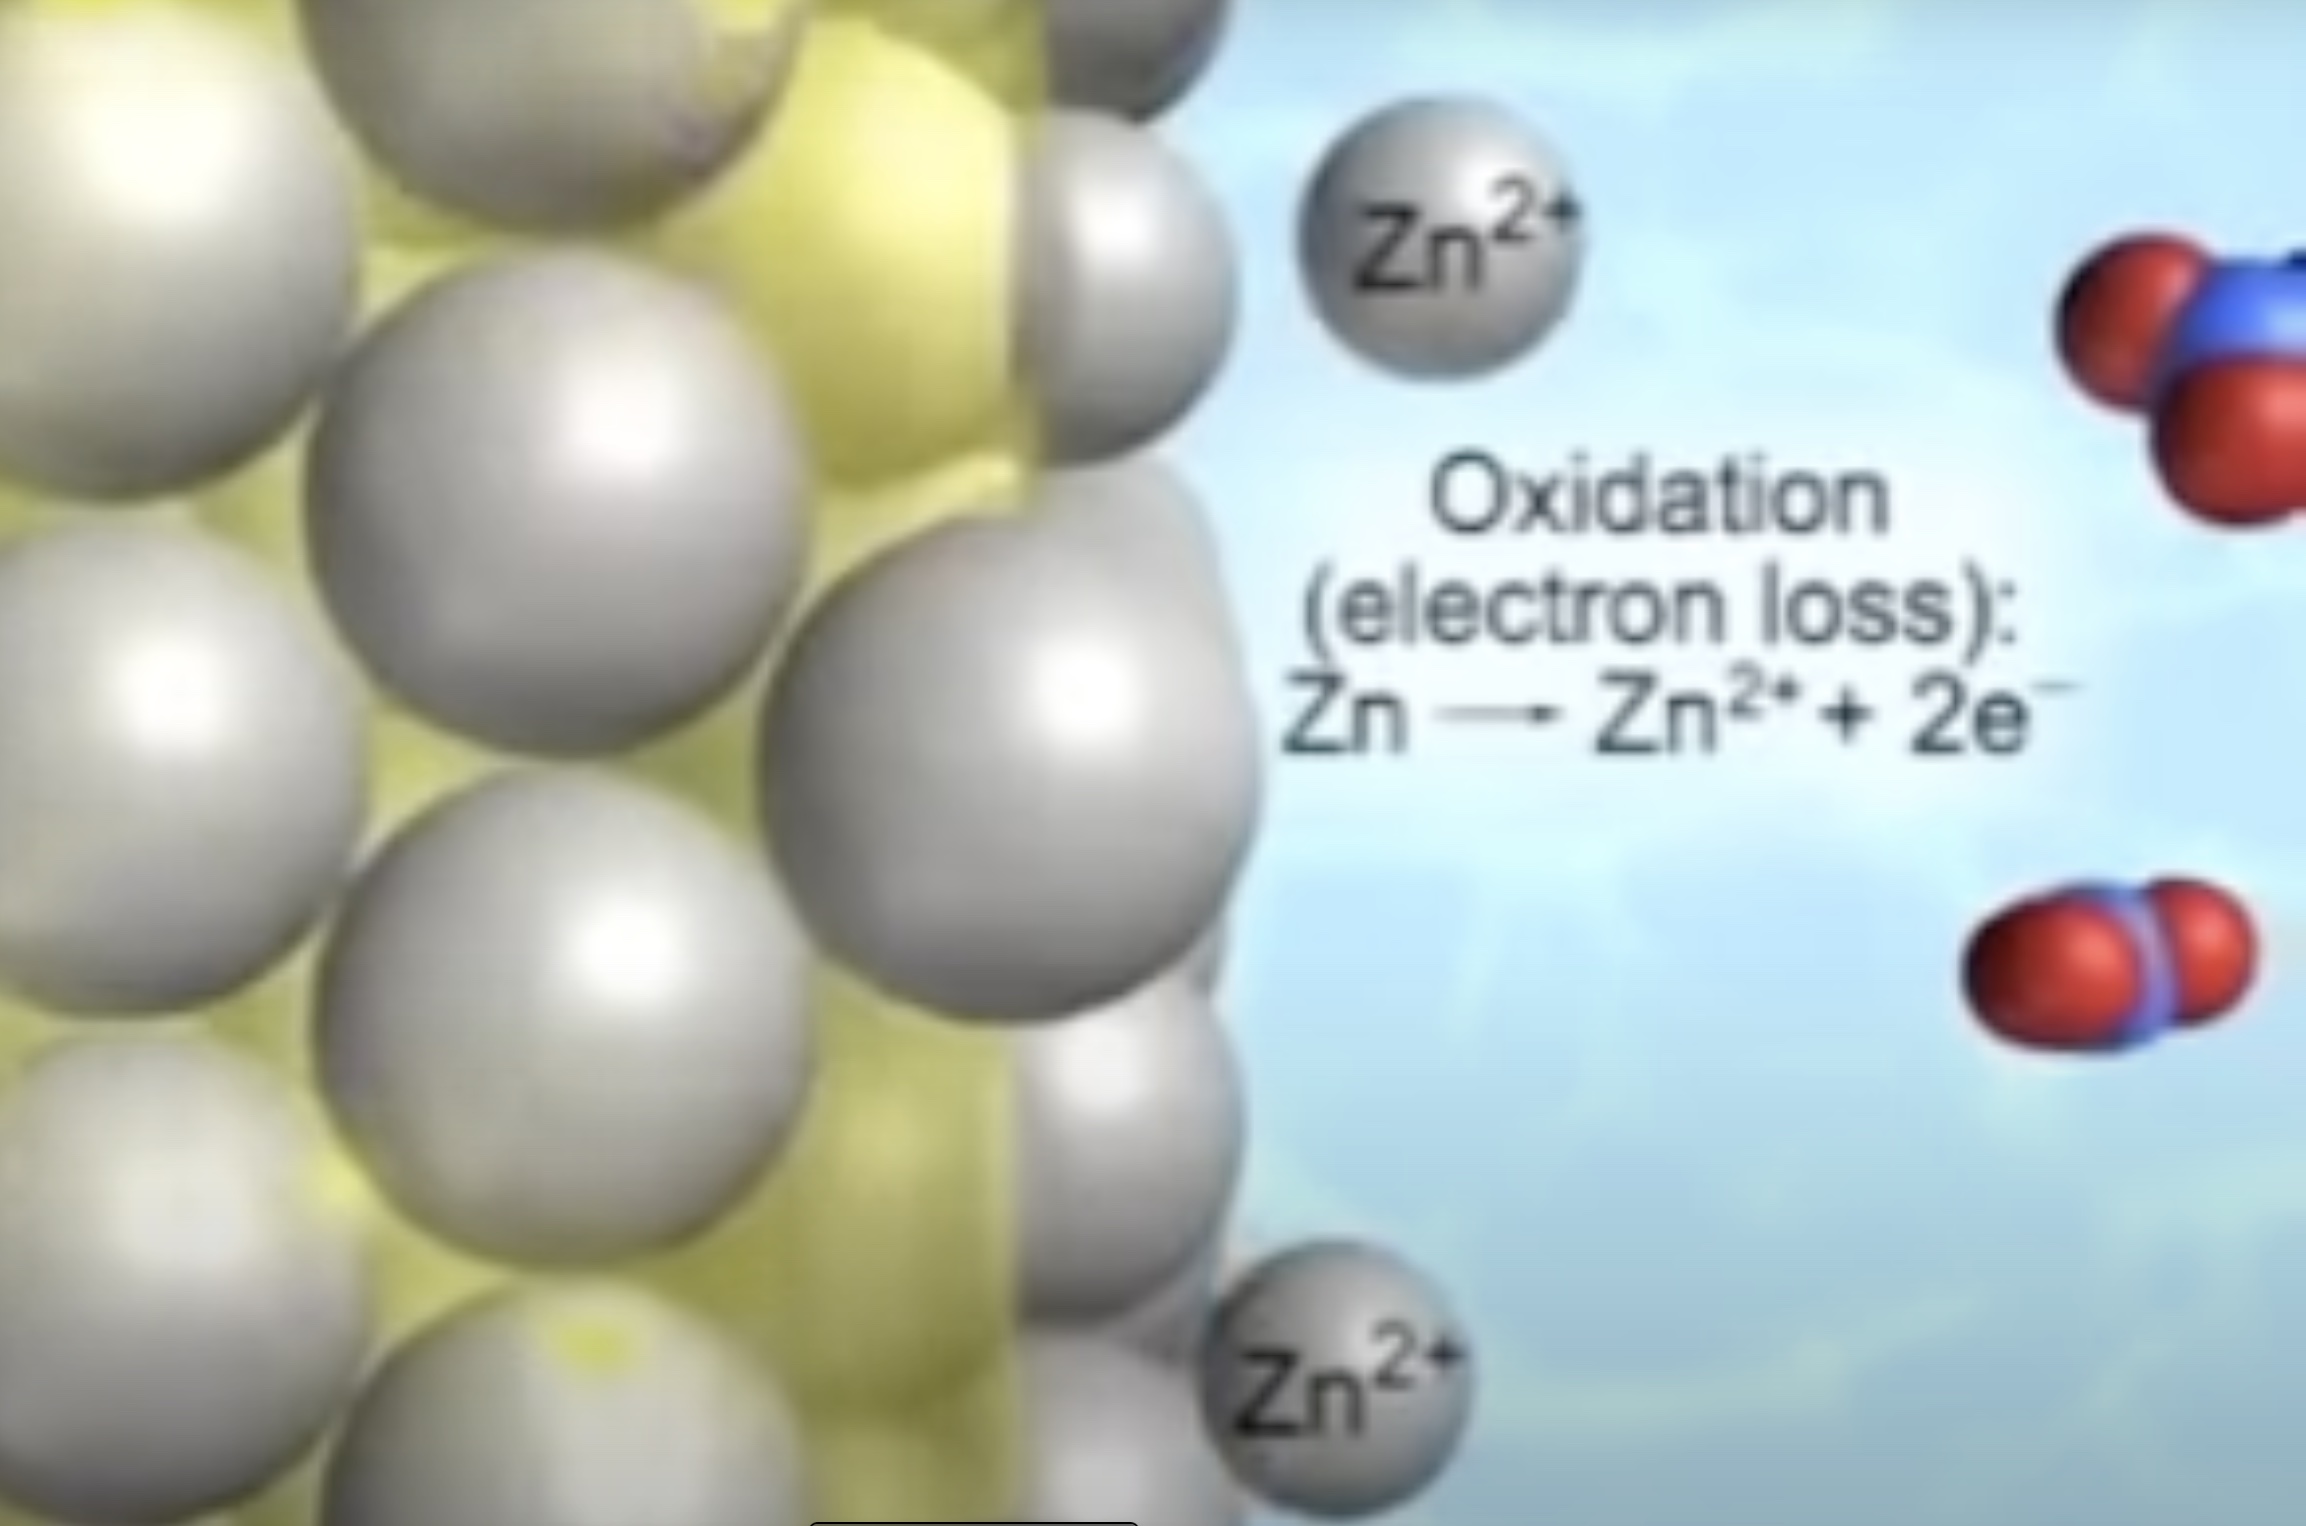
Students view a computer simulation of the ZnCu cell showing the dynamic oxidation half-reaction process occurring at the anode and then the dynamic reduction half-reaction process occuring at the cathode.
ACS AACT voltaic cell Galvanic/Voltaic Cells 1 computer simulation. Greenbowe, T.J.; Gelder, J.I., Boyd, A, Wixon, M. (2020). Galvanic/Voltaic Cells 1. American Association of Chemistry Teachers, American Chemical Society: Washington, D.C.
https://teachchemistry.org/classroom-resources/voltaic-cells
If you use the simulation, cite the simulation. The simulation may not be used in any lesson sold for profit.
Next, students view a particle level animation of what occurs in the salt-bridge containing aqueous saturated potassium nitrate. The cations and anions migrate in opposite direction. The cations migrate toward the cathode and the anions migrate toward the anode. No electrons are observed in the solution in the salt bridge or in the aqueous solutions. In the aqueous solutions (and the saturated solution in the salt bridge) migration of cations and anions in opposite direction constitutes a current.
ACS AACT voltaic cell Galvanic/Voltaic Cells 1 computer simulation. Greenbowe, T.J.; Gelder, J.I., Boyd, A, Wixon, M. (2020). Galvanic/Voltaic Cells 1. American Association of Chemistry Teachers, American Chemical Society: Washington, D.C.
Students record the cell potential from the voltmeter and use their data to determine the reduction potential of each half reaction. Students will also identify anodes and cathodes, write half reaction equations and full chemical equations, and draw what is happening in each half cell and the salt bridge on a molecular scale on a provided blank cell diagram.
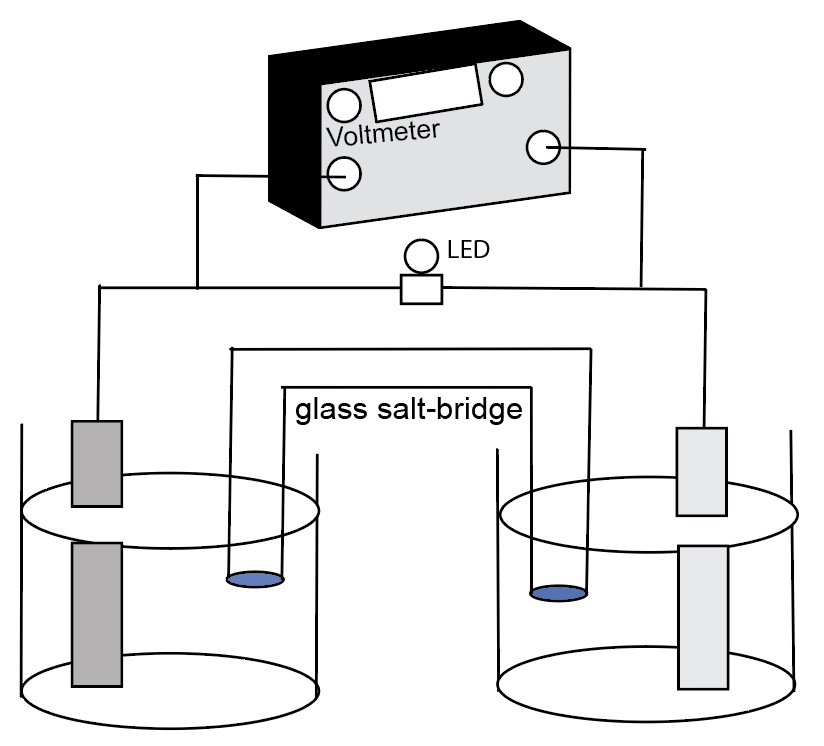
There is an activity sheet to accompany this presentation.
Example of student work
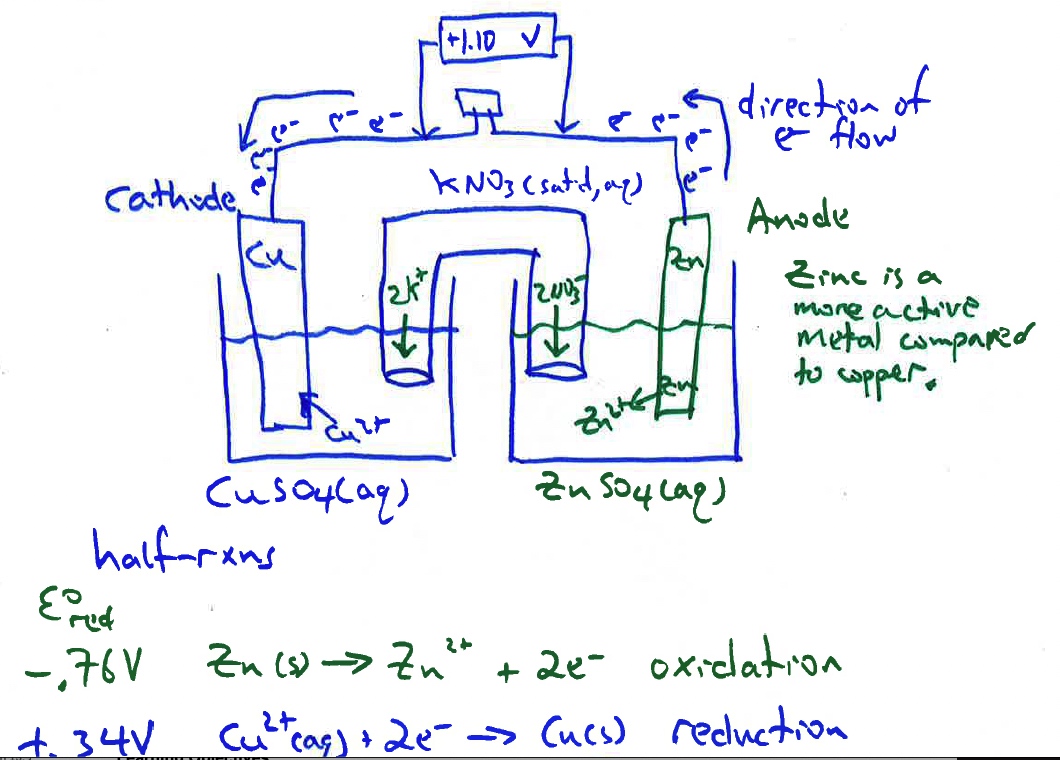
The cell reaction is Zn(s) + Cu2+(aq) --> Zn2+(aq) + Cu(s) E°cell = +1.10 Volts.
E°cell = E°cathode (as a reduction potential) - E°Anode(as a reduction potential) = +0.34 V - (-0.767 V)=+ 1.10 V
The simulation has a limited number of metals and solutions to construct galvanic/voltaic cells with different electrodes.
Curriculum Notes
Prior to doing these electrochemical cells demonstrations, it is recommended that the demonstration showing the reaction of zinc with CuSO4(aq) and the no reaction of copper with ZnSO4(aq) be shown and discussed. This is a great demo to introduce the concept of electrochemical cells. Pair this demonstration with computer animations showing a representation of the oxidation half-reaction occurring at the zinc anode and the reduction half-reaction occurring at the copper cathode.
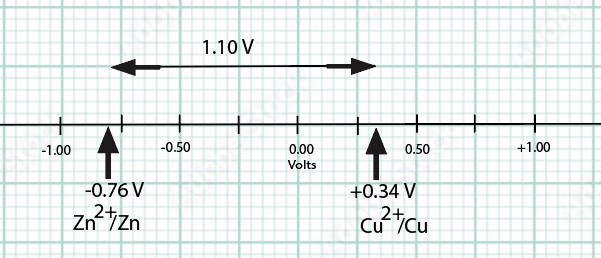
Due to a differences in electromotive force between zinc and copper, zinc is a more active metal compared to copper, a spontaneous oxidation-reduction process occurs when the zinc electrode is connected to the copper electrode and a salt bridge inserted between the two half-cells. The spontaneous flow of electrons from anode to cathode and the migration of cations and anions in the solutions and salt bridge generates a current with a voltage near the theoretical Eo cell = 1.10 V at room temperature.
Eoreduction (Volts)
Cathode Cu2+ + 2 e- → Cu + 0.34
Anode Zn2+ + 2 e- → Zn - 0.76
To determine the cell emf, we take the difference between reduction potentials. The cell potential is the potential difference between two half-cell reactions in a voltaic cell. In order to obtain this difference we need to "compare apples to apples".
The cell reaction is Zn(s) + Cu2+(aq) --> Zn2+(aq) + Cu(s) E°cell = +1.10 Volts.
E°cell = E°cathode (as a reduction potential) - E°Anode(as a reduction potential) = +0.34 V - (-0.767 V)=+ 1.10 V
Additional Video Links leading to electrochemical cells
http://www.youtube.com/watch?v=0oSqPDD2rMA
Computer animations for the Zn/Cu Voltaic cell beta versions (drafts) University of Oregon
Zn|Zn2+ oxidation half-reaction at the zinc electrode https://vimeo.com/220550690
Cu2+|Cu reduction half-reaction at the copper electrode https://vimeo.com/220550267
animation of the migration of ions in the salt-bridge https://vimeo.com/220548484
animation of the movement of electrons in a wire https://vimeo.com/220550589
An alternative to the AACT Voltaic Cells simulation is a zinc-copper electrochemical cell animation with narration created by Chris Singh.
1. Cell potentials are obtained by adding individual reduction potentials
2. Anodes, like anions, are always negatively charged and release electrons, and cathodes, like cations, are always positively charged and attract electrons.
3. The anode is positively charged because it has lost electrons. The cathode is negatively charged because it has gained electrons.
4. Electrons flow through the salt bridge and the electrolyte solutions to complete the circuit,
Learning ObjectivesReferences
Cole, M. H., Fuller, D. K., & Sanger, M. J. (2021). Does the way charges and transferred electrons are depicted in an oxidation–reduction animation affect students’ explanations? Chemistry Education Research and Practice, 22(1), 77–92.
Greenbowe, T.J. (1994). "An interactive multimedia software program for exploring electrochemical celIs." Journal of Chemical Education, 71(7), 555.
Greenbowe, T.J.; Gelder, J.I., Boyd, A, Wixon, M. (2020). Galvanic/Voltaic Cells 1. American Chemical Society, American Association of Chemistry Teachers, Washington, D.C. https://teachchemistry.org/classroom-resources/voltaic-cells
Sanger, M.J. and Greenbowe, T.J. (1997). “Student Misconceptions in Electrochemistry: Current Flow in Electrolyte Solutions and the Salt Bridge.” Journal of Chemical Education, 74(7), 819-823.
Sanger, M. J. and Greenbowe, T.J. (1997). “Common Student Misconceptions in Electrochemistry: Galvanic, Electrolytic, and Concentration Cells.” Journal of Research in Science Teaching, 34(4), 377-398.
Sanger, M.J. and Greenbowe, T.J. (1999). “An Analysis of College of Chemistry Textbooks as Sources of Misconception and Errors in Electrochemistry.” Journal of Chemical Education, 76(6), 853-860.
Sanger, M. J.; Greenbowe, T. J; Addressing student misconceptions concerning electron flow in aqueous solutions with instruction including computer animations and conceptual change strategies. International journal of science education, 2000, Vol.22 (5), p.521-537.
Shakhashiri, B. Z. In Chemical Demonstrations: A Handbook for Teachers of Chemistry; The University of Wisconsin Press: 1992; Vol. 4, p 101-106.
de Jong O. and Treagust D. F., (2002), The teaching and learning of electrochemistry, in Gilbert J. G., de Jong O., Justi R., Treagust D. F. and van Driel J. H. (eds.), Chemical education: towards research based practicale, Dordrecht: Kluwer, pp. 317-338.
Abraham, M.; Gelder, J.; Greenbowe, T. (2007). During Class Inventions and Computer Lab Activities for First and Second Semester General Chemistry. Hayden-McNeil: Plymouth, MI.
Johnstone, A.H. (1993). "The development of chemistry teaching: A changing response to changing demand. " Journal of Chemical Education, 70(9), 701-705.
