This presentation illustrates how chemical reactions can generate electricity. Electrochemical cells based on an electromotive force (emf) generated by virtue of a difference in concentration between two half-cells having the same type of metal electrodes and corresponding aqueous solutions not at 1.0 M, called a Concentration Cell. These are electrochemical cells that operate with a difference in concentration between two half-cells having solutions are not at standard conditions (i.e. not 1.0 M). This presentation uses a series of real concentration electrochemical cell and a series of concentration cells from a computer simulation (AACT) to help students understand the concepts associated with non-standard electrochemical cells and the use of the Nernst equation.
For example, a half-cell of dilute solution of copper(II) sulfate with a copper electrode is connected by a salt bridge to a half-cell with 0.010 M copper(II) sulfate with a copper electrode. The emf of the cell is E = +0.58 Volts.
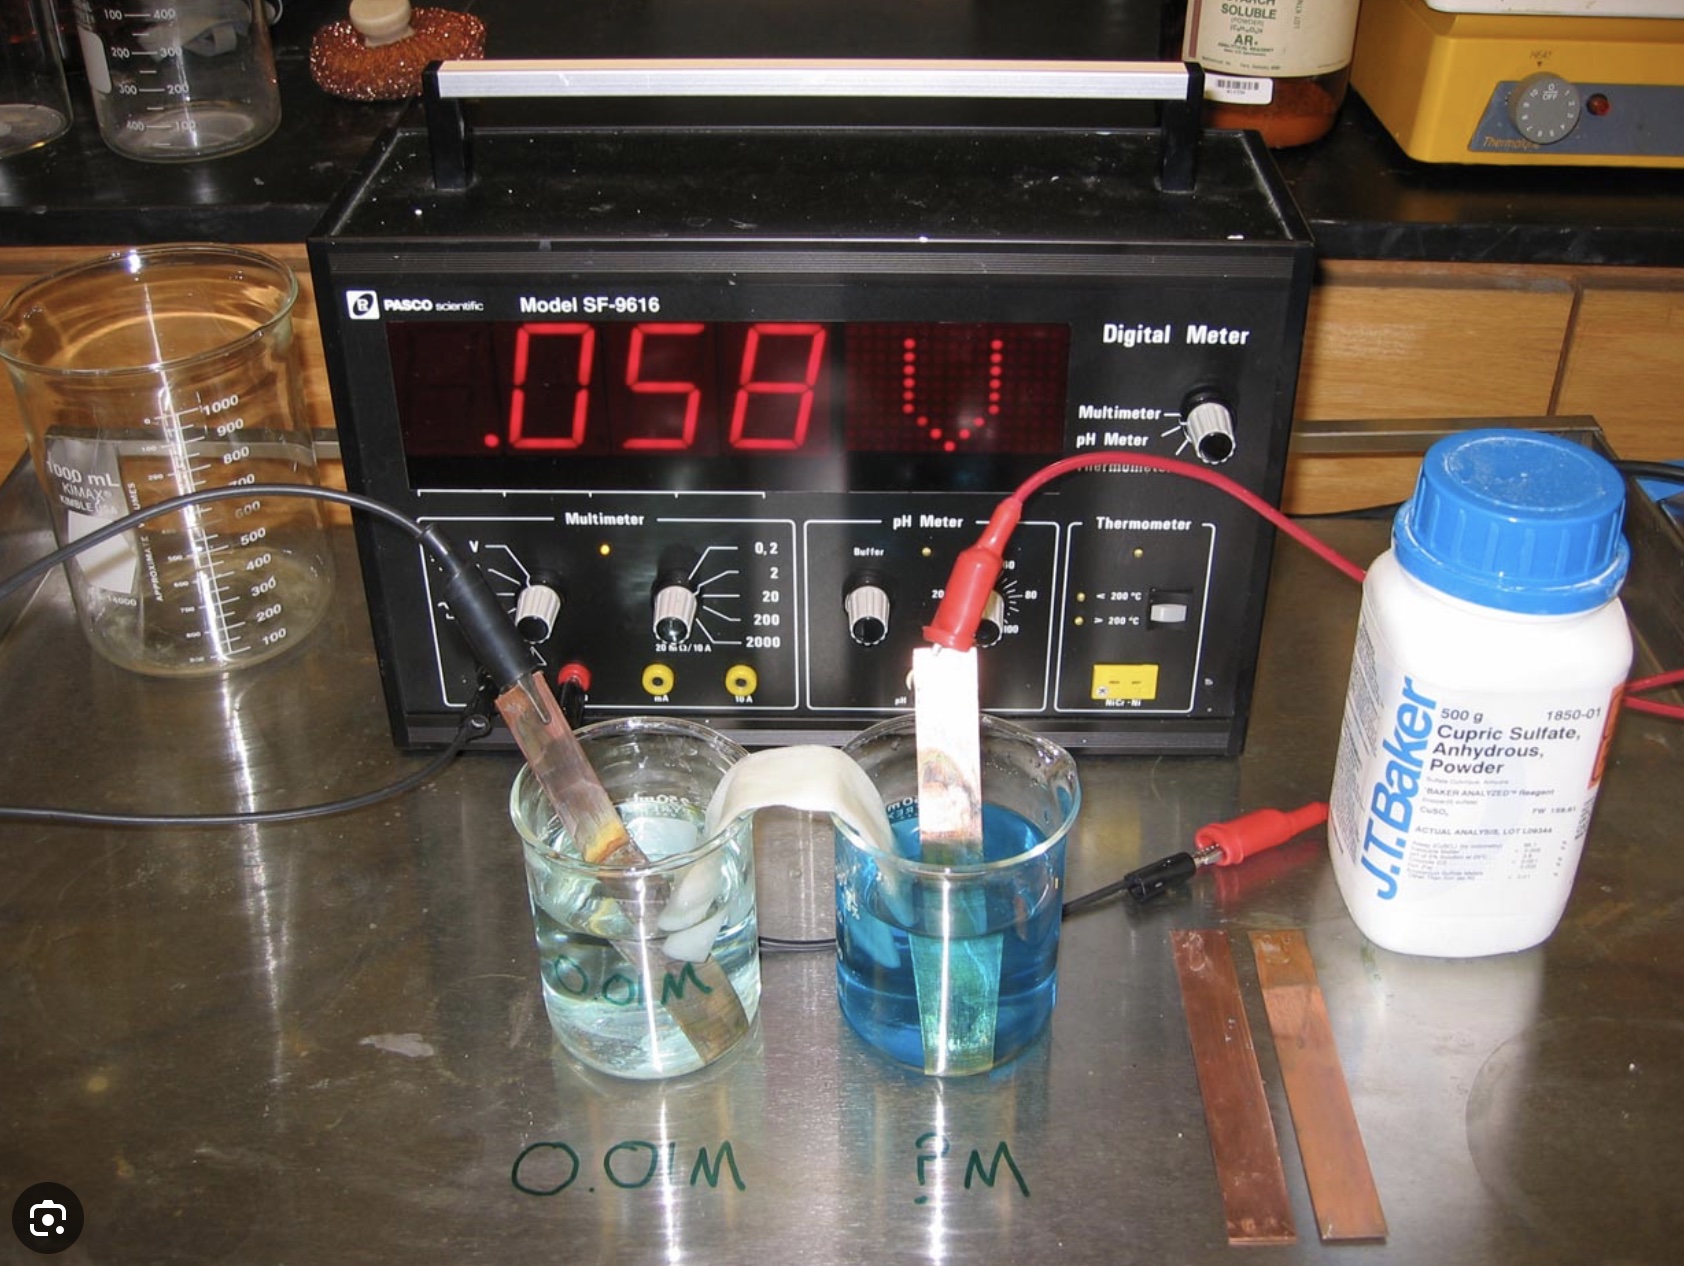
Image from John Straub's Lecture notes, Boston University.
https://people.bu.edu/straub/courses/demomaster/concentrationcell.html [accessed May, 2023]
The photograph above has two copper strips. One copper electrode is in a 0.010 M copper(II) nitrate soution. The other electrode is in a solution marked "?".
The goal of this part of the demonstration is to have students determine the concentration of the unknown copper(II) nitrate solution using the Nernst equation.
What this presentation offers with respect to learning electrochemistry
- Electrical energy can be generated by chemical reactions occuring due to a difference in concentration of solutions in half-cells.
- Connections among the three levels of representation: macroscopic (physical electrochemical cells), symbolic (chemical equations, cell diagrams), and the microscopic - particle level (particle level drawings, animations at the particle level).
- Introduction and application of the Nernst equation. Understanding the Nernst equation at a conceptual level.
Start the demonstration by showing the voltage of a copper-copper concentration cell with both solutions 1.00 M Cu2+. The cell potential is 0.00 Volts
Next set-up a copper-copper concentration cell one solution 2.00 M Cu2+and the other solutions 0.001 M Cu2+. The cell potential is +0.01 Volts.
The reaction occuring at the anode is an oxidation half-reaction Cu(s) -> Cu2+(aq, 0.0010 M) + 2e-
The reaction occuring at the cathode is a reduction half-reaction Cu2+(aq, 2.00 M) + 2e- -> Cu(s)
The cell reaction is Cu(s) -> Cu2+(aq, 0.001 M) + 2e-
Cu2+(aq, 2.00 M) + 2e- -> Cu(s)
___________________________
Cu2+(aq, 2.00 M) --> Cu2+(aq, 0.0010 M)
The cell potential, E, can be determined using the Nernst equation

Q = Cu2+(aq, 0.0010 M)/Cu2+(aq, 2.00 M) = [Cu2+ dilute]/ [Cu2+ concentrated] = 0.0010 M/ 2.00 M
E = E° -(0.0592)/2 log(0.0010/2.00) = 0.00 V - (0.0592)/2(log 0.0005) = +0.097 Volts = +0.10 Volts
For a copper-copper concentration cell the cell potential is related to the concentration of Cu2+ ions in solution. The greater the difference between the concentration of Cu2+ in the two half-cells, [Cu2+], the larger the potentail difference (voltage). A graph of cell potential difference versus log various [Cu2+] , dilute half-cell, shows this relationship. The concentration of Cu2+ in the other half-cell is kept at 1.00 M.
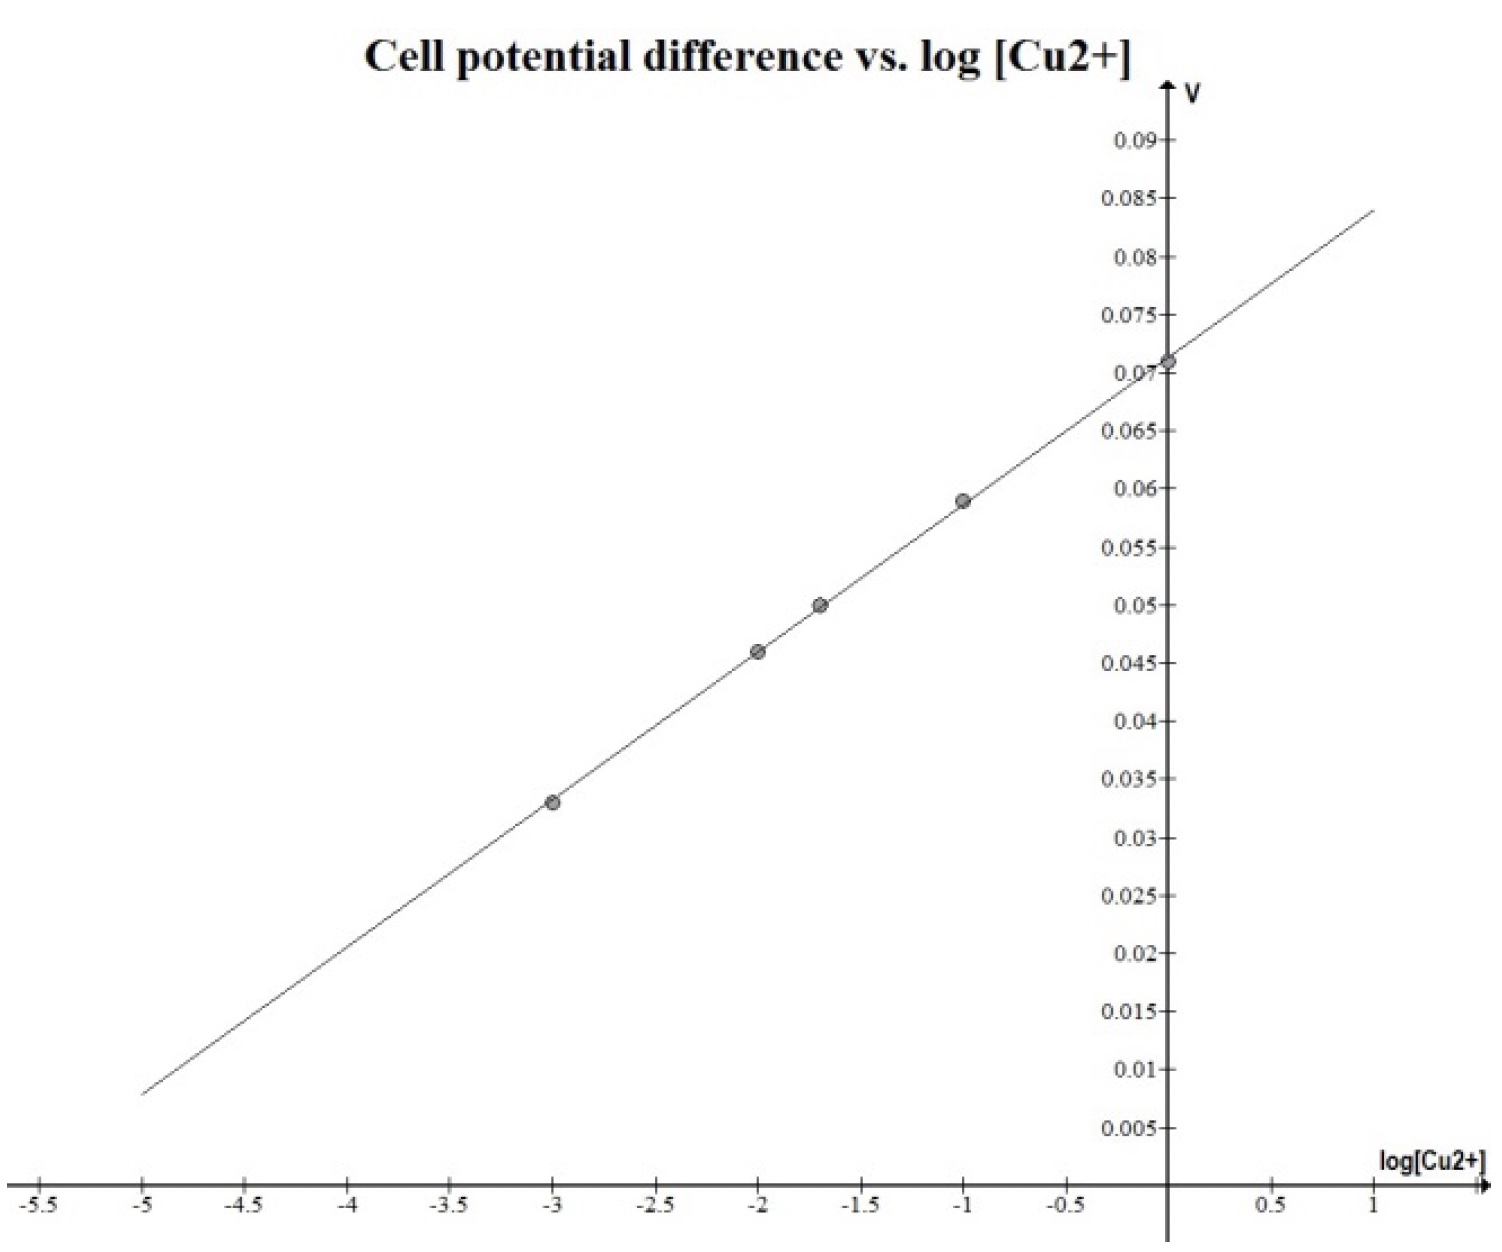
Michiel Vogelezang, and Adri Verdonk, World Journal of Chemical Education, vol. 8, no. 3 (2020).
Web page author: T. Greenbowe, University of Oregon. This page is under construction.
Solutions, Chemicals and Materials
- 2.00 and 1.00 molar copper (II) sulfate solution
- 0.10 M. 0.010 M, 10 millimolar copper(II) sulfate solution
- 20 g of solid copper(II) sulfate
- 1.00 M potassium sulfate (to maintain ionic strength in the low conentration solutions)
- 2.00 M potassium sulfate (solution for the salt bridge)
- Two clean copper metal strips
- 2.00 M and 1.00 Molar zinc (II) sulfate solution
- 20 g of solid zinc sulfate
- 0.10 M, 0.010 M, 10 millimolar zinc (II) sulfate solution
- Two clean zinc metal strips
- 200 mL deionized water
Metals: copper, zinc, magnesium, silver.
Aqueous solutions: copper(II) nitrate, zinc nitrate, magnesium nitrate, silver nitrate concentrations: 2.0 M, 1.0 M, 0.10 M, 0.010 M, 0.0010 M
Equipment
- Four 400 mL beakers
- Two salt bridges filled with potassium sulfate
- Digital Voltmeter
- Red and black wires with alligator clips
- Label Tape
- Paper towels
Procedures
I. Copper concentration cell (same metal electrodes, same type of ions in solution, different concentration of ions) Copper electrodes, CuSO4(aq) solutions
A. Place 100 mL of 1.0 M copper (II) sulfate solution in a beaker and place 100 mL of 1.0 M solution of copper(II) sulfate in the other beaker. Place copper metal strips in each solution. Use the black and red wires with aligator clips to connect the copper strips to the voltmeter. Complete the circuit by inserting a salt bridge between the two solutions. The voltage measurement should be zero Volts.
B. Place 100 mL of 2.0 M copper (II) sulfate solution in a beaker and place 100 mL of 10 millimolar (0.001M) solution of copper(II) sulfate in the other beaker. Place copper metal strips in each solution. Use the black and red wires with aligator clips to connect the copper strips to the voltmeter. Note which electrode is connected to which terminal of the voltmerter.
Complete the circuit by inserting a salt bridge between the two solutions. The voltage measurement should be +0.10 Volts. Have students complete a diagram of this electrochemical cell, identfy ten things about an electrochemical cell. See activity sheet.
C. Place 100 mL of 2.0 M copper (II) sulfate solution in a beaker and place 100 mL of 2.0 M solution of copper(II) sulfate in the other beaker. Place copper metal strips in each solution. Use the black and red wires with aligator clips to connect the copper strips to the voltmeter.
- Ask students to predict the voltage of this cell and explain their reasoning.
Complete the circuit by inserting a salt bridge between the two solutions. The voltage measurement should be ___ Volts. Ask student to explain.
- The potential difference or cell potential of an electrochemivcal cell depends upon
- the identity of the half-reactions occuring in each half-cell and
- the concentration of the ions in each of the solutions.
- if the concentration of ions in each solution is the same, the potentail difference will be zero Volts.
- The potential difference (voltage) does not depend upon the amount of material (mass and volume) in the half-cells. Doubling the volume of a solution (keeping the concentration constant) will not influence the half-cell potential difference or reduction potential.
Ask students the following questions: "If we want to maximize the voltage from this type of cell, how should we select the concentration of ions?" "In which directions do electrons flow in this cell?" "What half-reactions occur at each electrode?"
Nature has a tendency to attempt to make the concentrations of the connected solutions to be equal. Becuase we are using the same metal for the electrodes in each half cell, the standard emf, E°, is 0.00 volts. As the reaction proceeds, we expect the dilute solution to become a bit more concentrated and the concentrated solution to become a bit dilute. Given enough time, the two solutions should have equal concentrations.
The way for this to occur is for copper metal atom from the electrode in the dilute solution to be reduced to copper(II) ions, thus increasing the Cu2+ ion concentration in solution. The copper electrode decreases in mass.
The reaction occuring at the anode will be an oxidation half-reaction
Cu(s) -> Cu2+(aq, 0.0010 M) + 2e-
In the half-cell with the concentrated Cu2+ ion solution, at the copper electrode, copper(II) ions gain electrons to beome copper atoms, thus decreasing the Cu2+ ion concentration in solution. The newly formed Cu atoms are platted on the electrode. This copper electrode increases in mass.
The reaction occuring at the cathode is a reduction half-reaction
Cu2+(aq, 2.00 M) + 2e- -> Cu(s)
The cell reaction is Cu2+(aq, 2.00 M) --> Cu2+(aq, 0.0010 M)
In a standard electrochemical cell with two copper half-cells, Cu(s)|Cu2+(aq)||Cu2+(aq)|Cu(s) where the cell reaction is
Cu(s) + Cu2+(aq)[1.0M] → Cu2+(aq)[1.0M] + Cu(s)
Using the standard reduction potentials for the copper half cells, we find (taking the difference of standard reduction potentials)
EoCu|Cu2+||Cu2+|Cu = EoCu2+|Cu - EoCu2+|Cu = 0.34V - 0.34V = 0.0V
When the concentrations of copper ions in each half-cells are equal, the system is at equilibrium. At the point of equilibrium, there is no driving force in the reaction, the voltage is zero. EoCu2+|Cu = 0 and ΔGoCu|Cu2+||Cu2+|Cu = 0 indicates that the reaction under standard state conditions of 1.0M solutions has no driving force
K = 10nEo/0.0592V = 1 (at 25C)
In any concentration cell when the half-cells have different concentrations the driving force is to have the concentration of ions in each half-cell equal. The concentrated solution will decrease in ions and the dilute will increase in ions.
Cu(s) + Cu2+(aq)[concentrated] → Cu2+(aq)[dilute] + Cu(s)
We know that EoCu|Cu2+||Cu2+|Cu=0, n=2, and Q=[Cu2+]dilute/[Cu2+]concentrated. The cell voltage at 25°C will be given by the Nernst equation
ECu|Cu2+||Cu2+|Cu = EoCu|Cu2+||Cu2+|Cu - (0.0592V/n) log10 Q
EoCu|Cu2+||Cu2+|Cu = 0.0V, Q = [Cu2+]dilute/[Cu2+]concentrated
ECu|Cu2+||Cu2+|Cu = - 0.0296V log10 [Cu2+]dilute/[Cu2+]concentrated
When the concentration of copper ions in the concentrated solution half-cell exceeds the concentration of copper ions in the dilute solution half-cell, Q < 1, the cell voltage E > 0, and ΔG < 0. The reaction will proceed spontaneously from the concentrated solution to the dilute solution to increase the concentration of copper ions in the dilute solution half cell.
When the concentrations of copper ions in each of the solutions in the half-cells are equal, the system is at equilibrium.
[Cu2+]dilute = [Cu2+]concentrated Q = [Cu2+]dilute/[Cu2+]concentrated = 1.00 log10 1.00 = 0
ECu|Cu2+||Cu2+|Cu = 0.0 Volts
The cell potential, E, can be determined using the Nernst equation

The potential difference or cell potential depends upon
- the identity of the half-reactions occuring in each half-cell and
- the concentration of the ions in each of the solutions.
The potential difference (voltage) does not depend upon the volume of solution in the half-cells. The potential difference does not depend upon the size of the electrodes.
- Standard reduction potentials for half-reactions in electrochemical cells are an intensive property of matter. Note the concentration of the solution must be 1.00 M and the temperature must be 25°C.
However, the current and the duration of the voltage does depend upon the amount of material.
Students use an activity sheet to write net ionic equations, indicate the electron flow in the wires and metal electrode and indicated the direction of migration of cations and anions within the salt bridge.
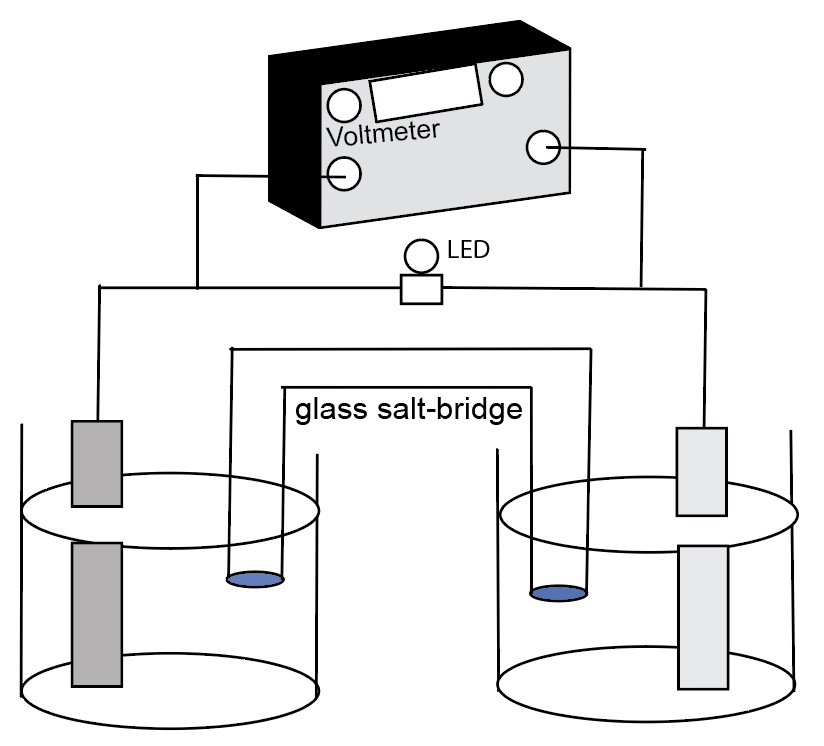
An activity sheet for this instructional event is available from the AACT web site.
Concentration Electrochemical Cells
A concentration electrochemical cell is a non-standard electrochemical cell has the same type of metal electrode in corresponding aqueous solutions both not at 1.0 M. In the image below, a half-cell of dilute solution of copper(II) sulfate with a copper electrode is connected by a salt bridge to a half-cell with concentrated copper(II) sulfate with a copper electrode. The cell voltage, E the emf of the cell, is E = +0.58 Volts. The goal is to determine the concentration of the solution marked "?".

Image from John Straub's Lecture notes, Boston University.
https://people.bu.edu/straub/courses/demomaster/concentrationcell.html [accessed May, 2023]
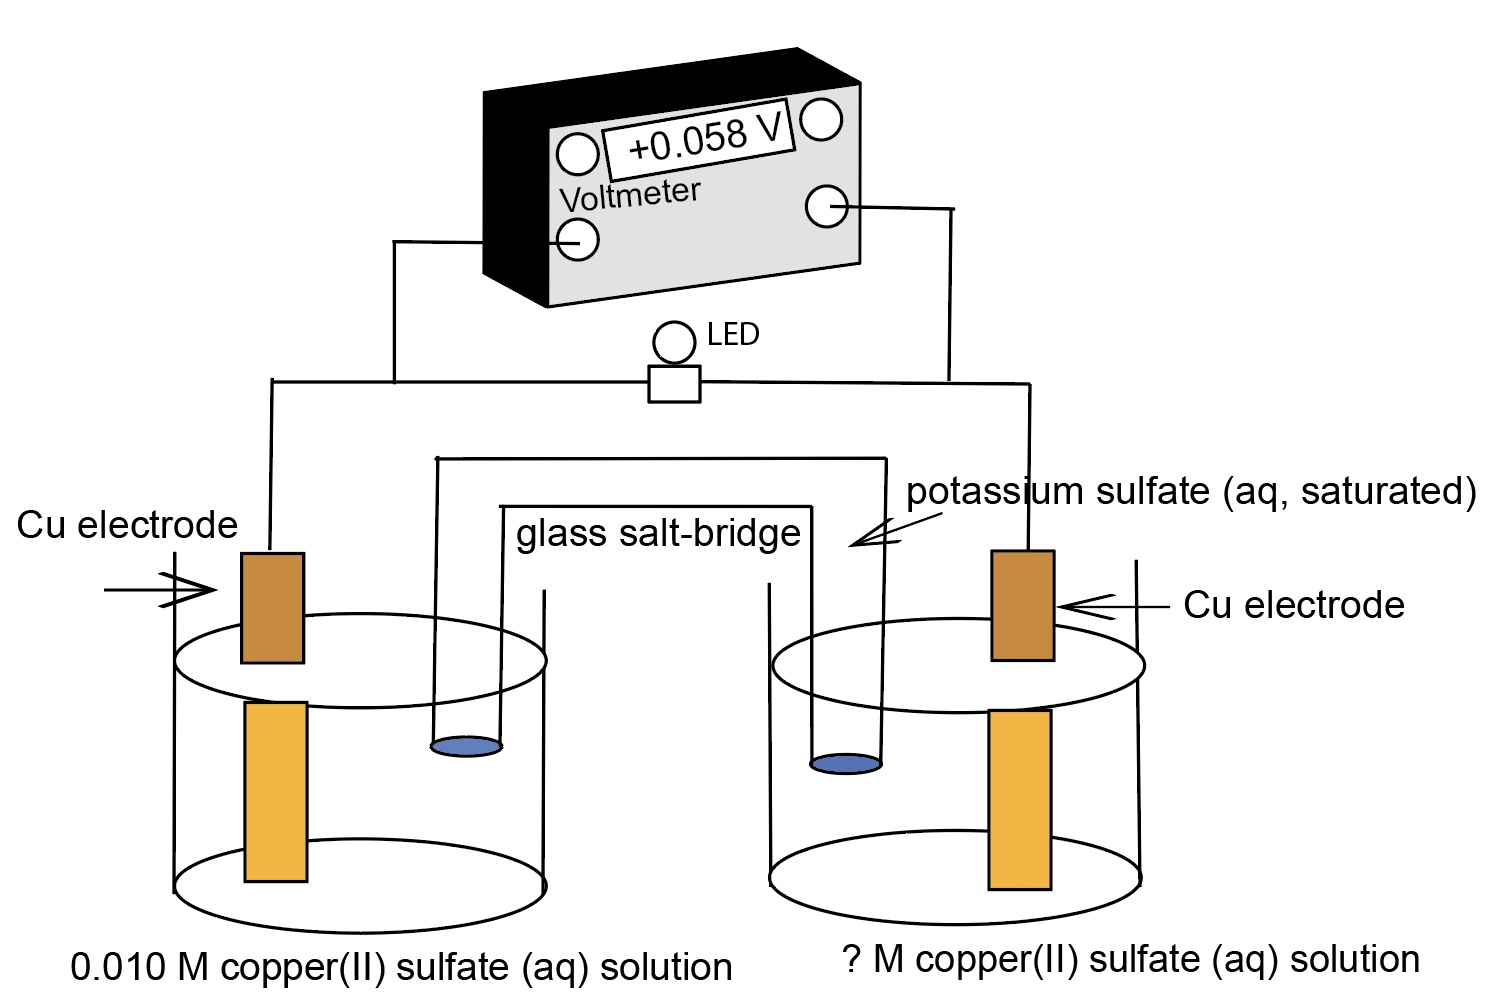
A diagram of copper concentration cell with a known Ecell value= +0.058 V and an unknown concentration of solution in one half cell. The unknown solution is more concentrated compared to the dilute solution.
The cell reaction is Cu(s) -> Cu2+(aq, 0.010 M) + 2e-
Cu2+(aq, ? M) + 2e- -> Cu(s)
___________________________
Cu2+(aq, ? M) --> Cu2+(aq, 0.010 M)
The cell potential, E, can be determined using the Nernst equation

Q = Cu2+(aq, 0.010 M)/Cu2+(aq, ? M) = [Cu2+ dilute]/ [Cu2+ concentrated] = 0.010 M/ ? M
E = E° -(0.0592)/2 log(0.010 M/? M)
0.058 V = 0.0V - [(0.0592)/2(log 0.010/x)]
0.058 V = - [(0.0592)/2(log 0.010) + (0.0592)/2(log x)
0.058 V = - [(0.0592)/2(-2) + (0.0296)(log x)]
0.058 V = - [(-0.0592) + (0.0296)(log x)]
0.058 V - 0.0592 V = - (0.0296)(log x)
-0.0012 V = - (0.0296)(log x)
0.0012 V/0.0296 V = log x
0.0405 = log x
10(0.0405) = 10[log x]
1.098 M = x = [Cu2+ concentrated]
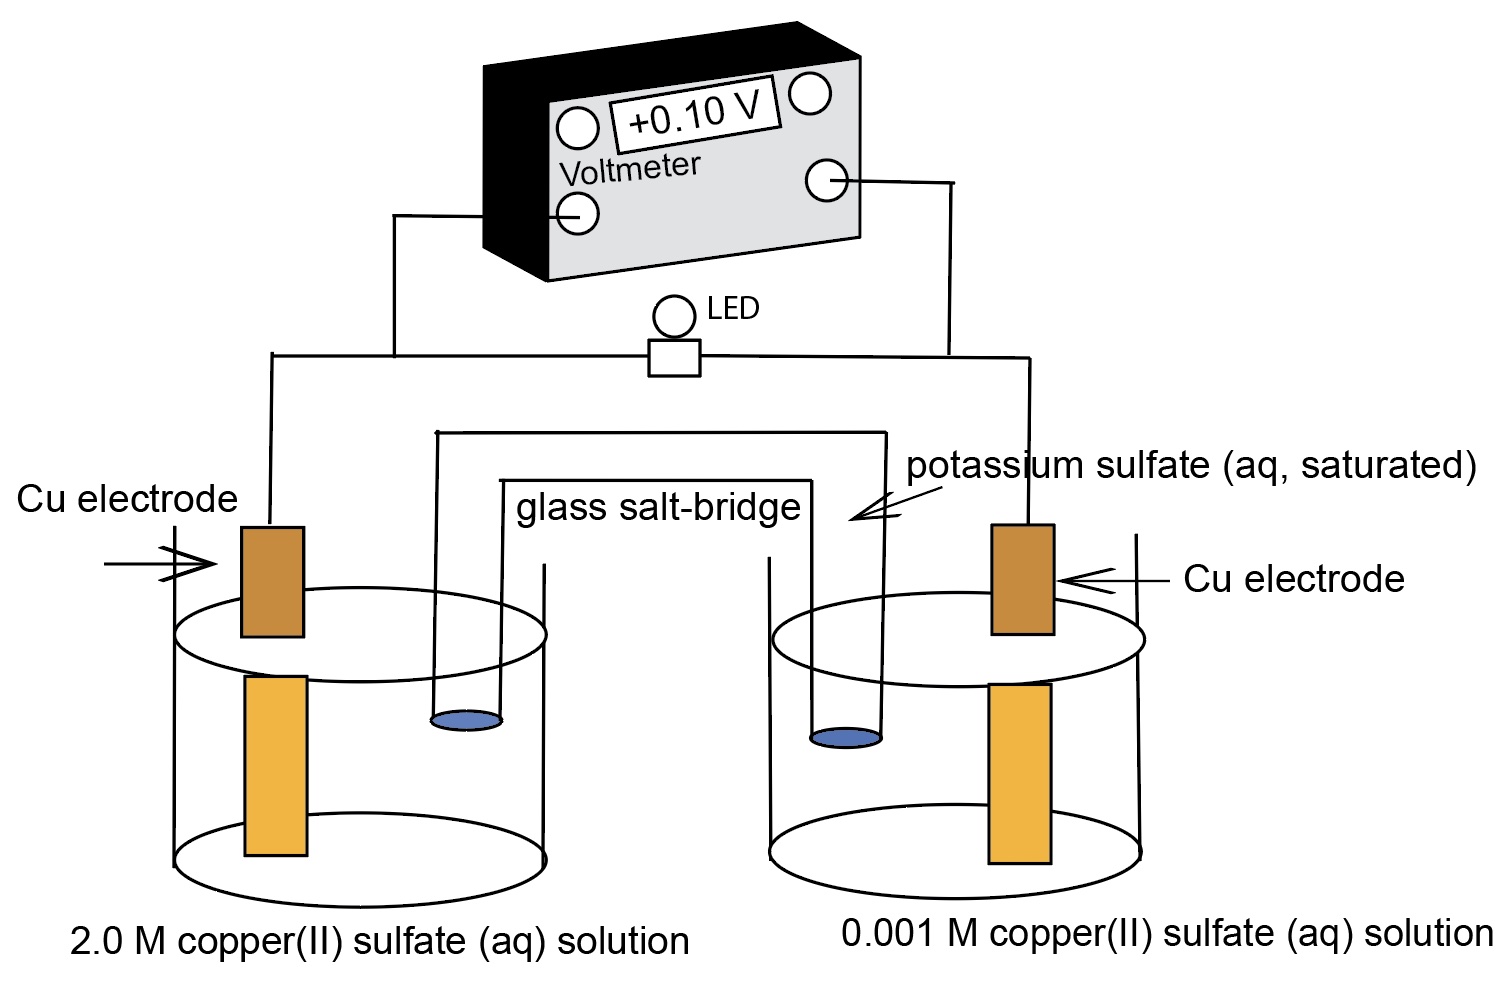
The following diagram illustrates the components of a copper concentration cell. One half-cell has a copper electrode in 2.0 M copper(II) sulfate solution. The other half cell has a copper electrode in 0.0010 M copper(II) sulfate solution. A salt bridge connects the two half-cells. A voltmeter measures the potential difference between the two half cells, +0.10 Volts.
xx
Show students the AACT electrochemical cell simulation of a copper concentration cell. Show the molecular scenes animations
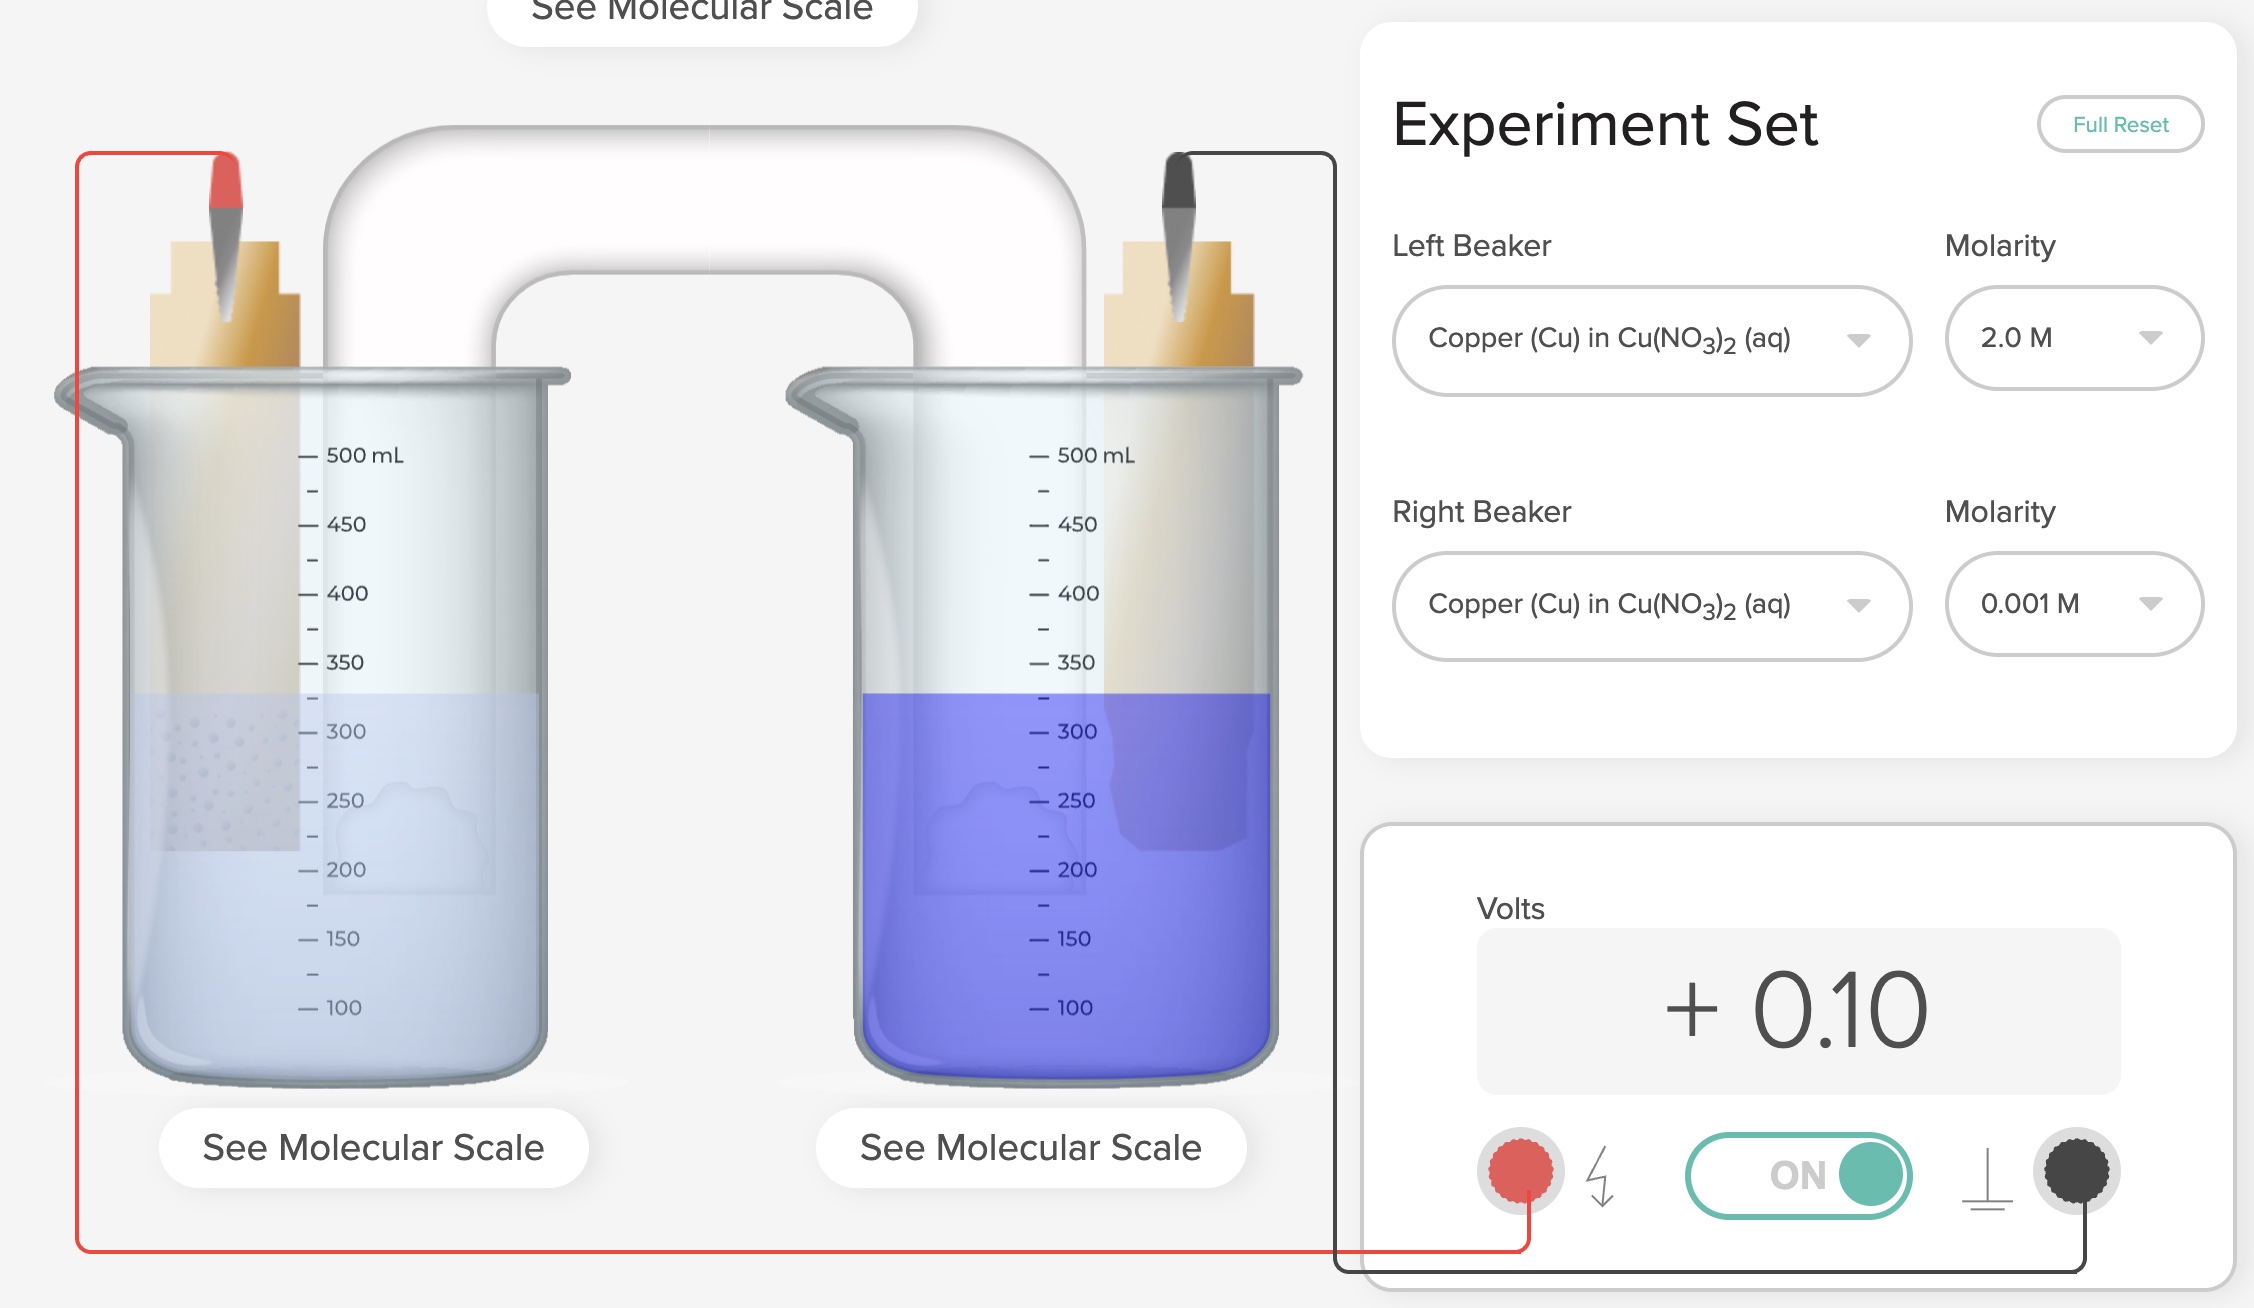
In the Galvanic/Voltaic Cells 2 computer simulation posted on the ACS AACT web site, one can construct a variety of non-standard voltaic cells. For each half-reaction, choose a metal and select the corresponding metal ion concentration of solution. Record the cell potential, E, from the voltmeter. Animations representing the processes that occur at the particle level at each electrode, and in the salt bridge. In the following copper concentration cell diagram, one half-cell has an initial concentration of 0.001 M Cu2+ and the other has a concentration of 2.00 M Cu2+. The emf of the cell is +0.10 Volts.
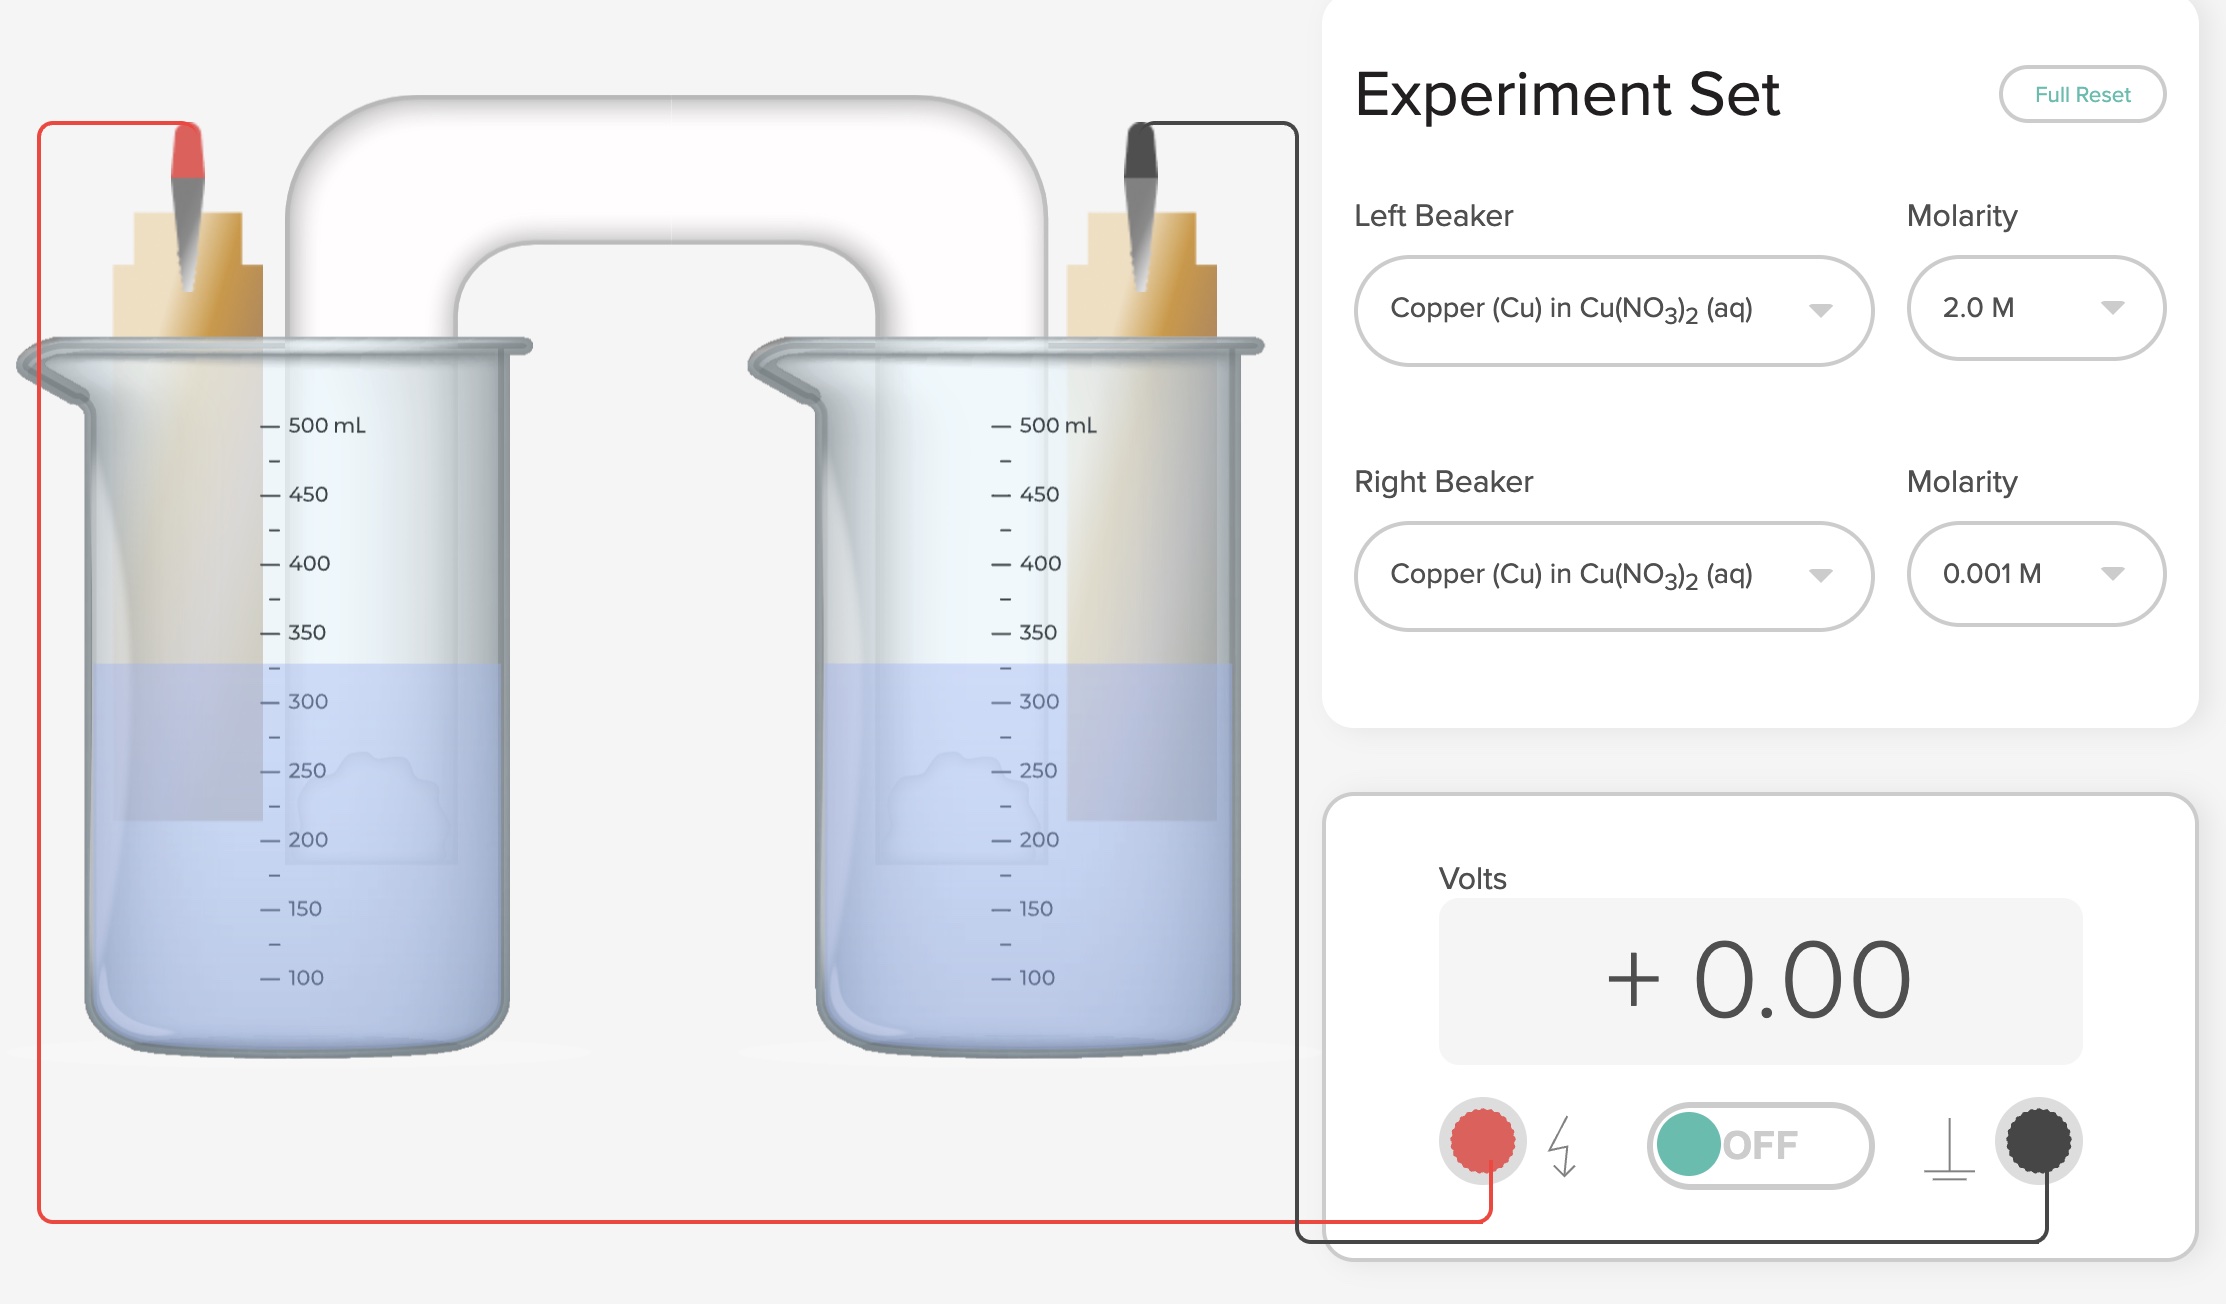
After some time, the two half-cells reach the same concentration of Cu2+ ions and the voltage is 0.00 Volts.
ACS AACT Computer Simulation: Galvanic/Voltaic Cells 2. Greenbowe, T.J.; Gelder, J.I., Boyd, A, Wixon, M. (2020). Galvanic/Voltaic Cells 2. American Association of Chemistry Teachers, American Chemical Society: Washington, D.C.
https://teachchemistry.org/classroom-resources/galvanic-voltaic-cells-2 [accessed May, 2023]
If you use the AACT Galvanic/Voltaic Cells 2 simulation, cite the simulation. The Galvanic/Voltaic Cells 2 simulation may not be used in lesson sold for profit.
The AACT Galvanic Cells/Voltaic Cells 2 computer simulation has animations at the particle level of these two half-reactions. In the animation below, the half-cell solution on the right should be a light blue color Cu2+ solution and the half-cell solution on the left should be a dark blue color Cu2+ solution. [A correct image will be used as soon as it becomes available.
ACS AACT Computer Simulation: Galvanic/Voltaic Cells 2. Greenbowe, T.J.; Gelder, J.I., Boyd, A, Wixon, M. (2020). Galvanic/Voltaic Cells 2. American Association of Chemistry Teachers, American Chemical Society: Washington, D.C.
https://teachchemistry.org/classroom-resources/galvanic-voltaic-cells-2 [accessed May, 2023]
If you use the AACT Galvanic/Voltaic Cells 2 simulation, cite the simulation. The Galvanic/Voltaic Cells 2 simulation may not be used in lesson sold for profit
This presentation, when the AACT simultion is included, provides an opportunity for students to make connections among the macroscopic, particle level, and symbolic levels of representation (Johnstone, 1982, 1991, 1993) associated with electrochemical cells.
This presentation/lesson is consistent with the principles of Universal Design for learning in that multiple representations are incorporated in the presentation. This presentation also provides an opportunity for students to make connections among the macroscopic, particle level, and symbolic levels of representation (Johnstone, 1982, 1991, 1993) associated with electrochemical cell processes. The AACT simulation has particle level animations of what occurs at the surface of the electrodes, migration of ions in the aqueous solution, oxidation and reduction half-reactions, and migration of ions in the salt bridge. Also, identification of which electrode is connected to the ground terminal and which electrode is connected to the "lightning bolt" terminal of the voltmeter.
Voltaic Cells Galvanic Cells 2 ACS AACT Simulation
For example, copper metal electrode in 2.0 M Zn(NO3)2 solution, a copper metal electrode in a 0.0010 M Cu(NO3)2 solution, and a connecting salt bridge. The electrodes are connected to a voltmeter. E cell = +0.058 Volts.
The following diagram identifies the components of a copper-cooper concentration electrochemical cell.
| [Cu2+ Dilute] (M) | [Cu2+ Concentrated] (M) | LogQ | Emf (Volts) |
| 0.0010 M | 2.00 M | -3.30 | +0.10 V |
| 0.0010 M | 1.00 M | -3.00 | +0.09 V |
| 0.010 M | 2.00 M | -2.30 | +0.07 V |
| 0.010 M | 1.00 M | -2.00 | +0.06 V |
| 0.10 M | 2.00 M | -1.30 | +0.04 V |
| 0.10 M | 1.0 M | -0.30 | +0.10 V |
| 1.00 M | 1.00 M | 0.00 | 0.00 V |
Have students quickly gather data and construct a graph.
Copper concentration cell E cell vs Log Q graph reveals an inverse linear relationship.
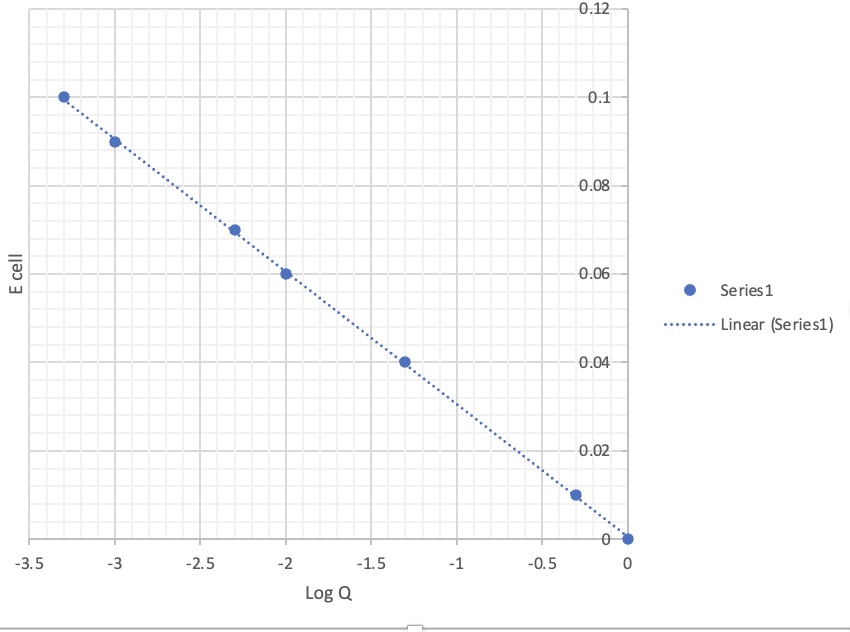
E = E°cell - (0.0591 Volts/n) x log {[Cu2+ dilute]/[Cu2+ concentrated]}
y = mx + b b = E°cell = 0.0 Volts n = 2 mole of e-
m = 0.059
Example: Silver concentration cell.
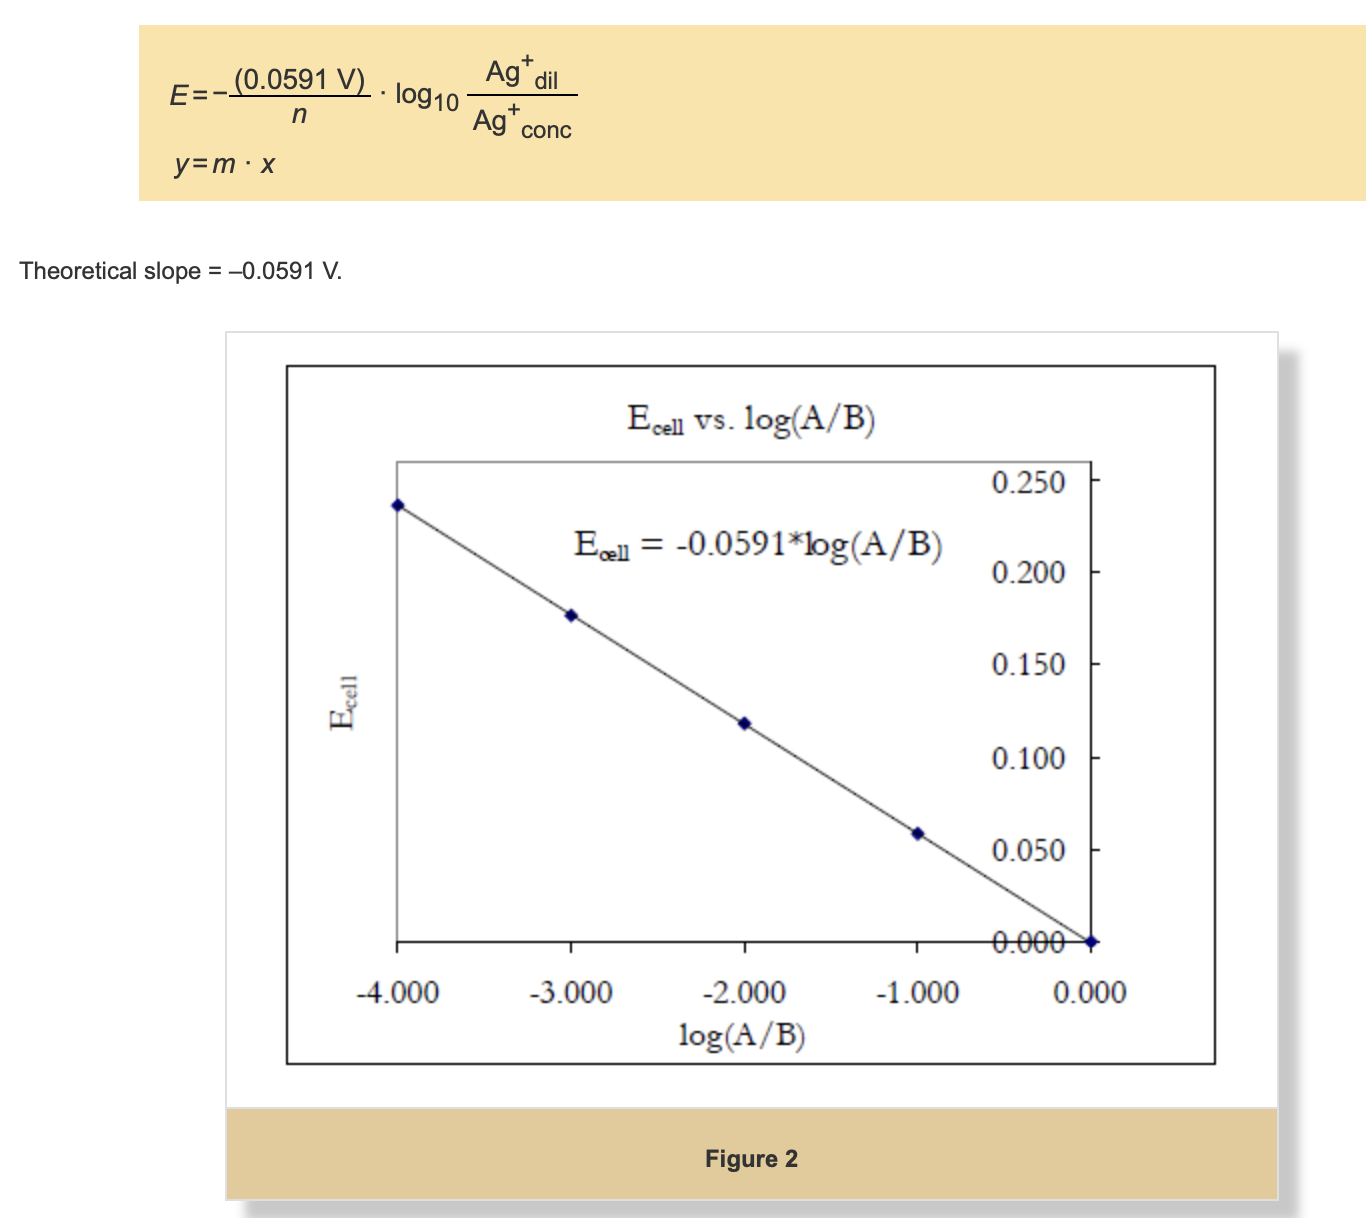
https://www.webassign.net/labsgraceperiod/ucscgencheml1/lab_13/manual.html
This presentation also provides an opportunity for students to make connections among the macroscopic, particle level, and symbolic levels of representation (Johnstone, 1982, 1991, 1993) associated with the dissolving process.
Some student Difficulties with Galvanic Cells or Electrochemical Cells
1. Cell potentials are obtained by adding individual reduction potentials
2. Anodes, like anions, are always negatively charged and release electrons, and cathodes, like cations, are always positively charged and attract electrons.
3. The anode is positively charged because it has lost electrons. The cathode is negatively charged because it has gained electrons.
4. Electrons flow through the salt bridge and the electrolyte solutions to complete the circuit,
Learning Objectives
References
Greenbowe, T.J. (1994). "An interactive multimedia software program for exploring electrochemical celIs." Journal of Chemical Education, 71(7), 555.
Greenbowe, T.J.; Gelder, J.I., Boyd, A, Wixon, M. (2020). Galvanic/Voltaic Cells 1. American Chemical Society, American Association of Chemistry Teachers, Washington, D.C. https://teachchemistry.org/classroom-resources/voltaic-cells
Sanger, M.J. and Greenbowe, T.J. (1997). “Student Misconceptions in Electrochemistry: Current Flow in Electrolyte Solutions and the Salt Bridge.” Journal of Chemical Education, 74(7), 819-823.
Sanger, M. J. and Greenbowe, T.J. (1997). “Common Student Misconceptions in Electrochemistry: Galvanic, Electrolytic, and Concentration Cells.” Journal of Research in Science Teaching, 34(4), 377-398.
Sanger, M.J. and Greenbowe, T.J. (1999). “An Analysis of College of Chemistry Textbooks as Sources of Misconception and Errors in Electrochemistry.” Journal of Chemical Education, 76(6), 853-860.
Sanger, M. J.; Greenbowe, T. J; Addressing student misconceptions concerning electron flow in aqueous solutions with instruction including computer animations and conceptual change strategies. International journal of science education, 2000, Vol.22 (5), p.521-537.
de Jong O. and Treagust D. F., (2002), The teaching and learning of electrochemistry, in Gilbert J. G., de Jong O., Justi R., Treagust D. F. and van Driel J. H. (eds.), Chemical education: towards research based practicale, Dordrecht: Kluwer, pp. 317-338.
Abraham, M.; Gelder, J.; Greenbowe, T. (2007). During Class Inventions and Computer Lab Activities for First and Second Semester General Chemistry. Hayden-McNeil: Plymouth, MI.
Johnstone, A.H. (1993). "The development of chemistry teaching: A changing response to changing demand. " Journal of Chemical Education, 70(9), 701-705.
