Nernst Cells. The dependence of the cell potential on the concentration of the ions in each of the half-cells is linked directly to the dependence of free energy, ∆G, of the cell on the concentration of the aqueous solutions. Using the simulation the concentration of the solutions can be varied and the emf of each cell measured. Calculating the reaction quotient, Q, provides a qualitative way to predict of the voltage of the cell will be higher than the standard voltage or lower. When the concentration of the ions in the anode half-cell is higher than the concentration of the ions in the cathode half-cell, the voltage of the cell under nonstandard conditions, E, is less than the standard voltage, E° cell.
Different metal electrodes are used in each half-cell, the two aqueous solutions ion concentrations in the half-cells are not at 1.00 M. The simulation has the following metals magnesium, zinc, copper, and silver. Aqueous solutions of the corresponding metals have concentrations of 2.00 M, 1.00 M, 0.10 M, 0.0100 M, 0.0010 M. The more active metal serves as the anode and governs the oxidation-half reaction.
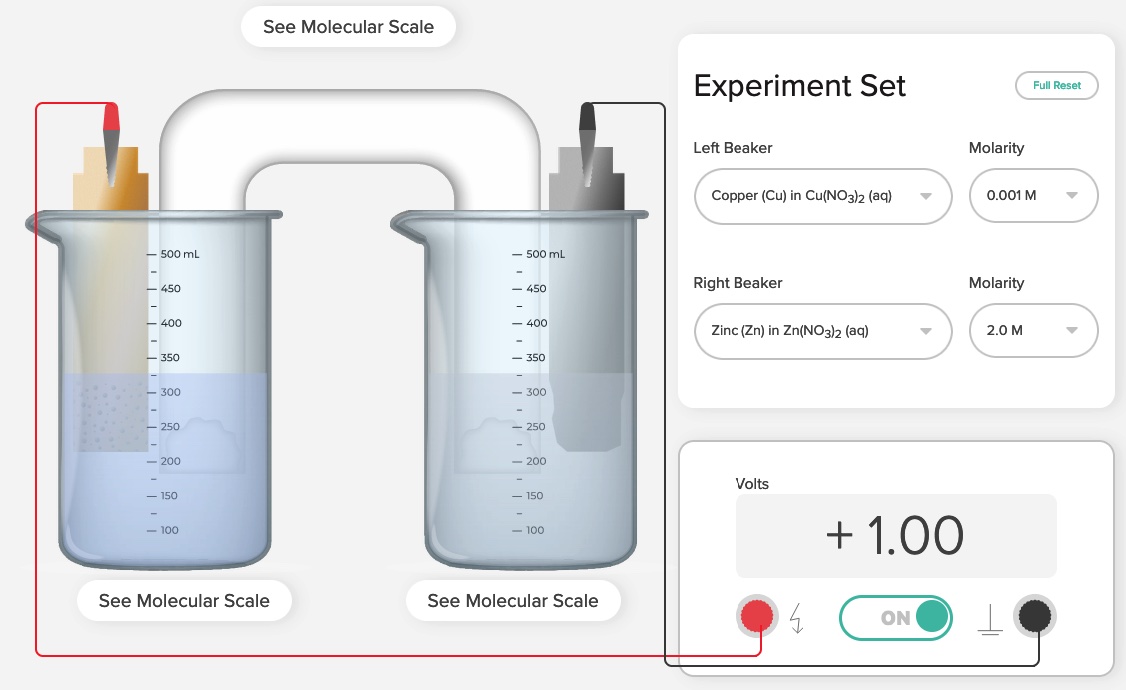
If zinc and copper metal electrodes are selected, one can choose the concentration of the zinc nitrate solution to be 2.0 M and the concentration of the copper(II) nitrate solution to be 0.0010 M. When the switch is closed to complete the circuit a voltage of +1.00 Volts is measured.

https://teachchemistry.org/classroom-resources/galvanic-voltaic-cells-2 [accessed May, 2023]
ACS AACT Galvanic/Voltaic Cells 2 computer simulation. Greenbowe, T.J.; Gelder, J.I., Boyd, A, Wixon, M. (2020). Galvanic/Voltaic Cells 2. American Association of Chemistry Teachers, American Chemical Society: Washington, D.C.
If you use the Galvanic/Voltaic Cells 2 simulation, please cite the simulation. The Galvanic/Voltaic Cells 2 simulation may not be used in a lesson sold for profit.
For this zinc-copper Nernst cell, we can use the Nernst Equation. The concentration of the ions in the zinc half-cell is higher (2.00 M) than the concentration of the ions in the copper half-cell, 0.0010 M, the voltage of the cell under nonstandard conditions, E is +1.00 Volt, which is less than the standard voltage, E° cell, +1.100 Volts.
For a reaction that is not in equilibrium, from the Gibbs free energy equation
![]()
where Q, the reaction quotient, equals the product of the concentrations of the products, each raised to the power of its stoichiometric coefficient, divided by the product of the reactant concentrations, each raised to the power of its stoichiometric coefficient. We can derive a form of the Nernst equation.
aA + bB -> cC + d D
Q =
We can use Q to replace the equilibrium constant Keq when we are not certain the system is at equilibrium. In electrochemistry, if the system is producing an emf (in units of volts), the system is not at equilibrium, but the system is going toward equilibrium.
When the temperature is 298 K, using the values for R and F and multiplying by the appropriate factor to convert from base e to base 10, 2.303:

For the zinc-copper Nernst Cell, the cell equation is Zn(s) + Cu2+(aq) -> Zn2+(aq) + Cu(s)
Q = [Zn2+]/[Cu2+] = [2.00 M]/[0.0010M] = 2,000.
E = +1.10 Volts - (0.0592/2)log(2,000)
E = +1.10 Volts - (0.0296)(3.30) = +1.10 Volts - 0.097 = +1.00 Volts
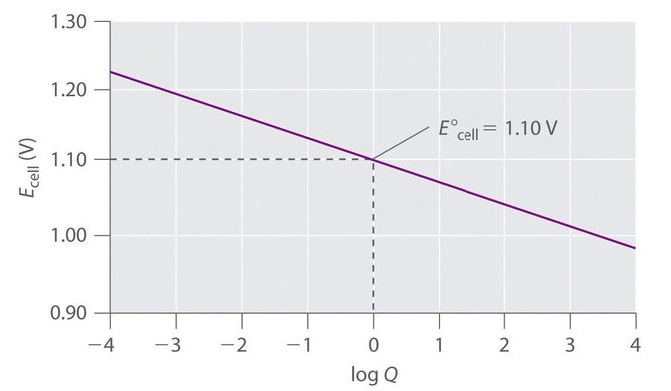
By varying the concentration of the ions in the half-cells, data can be generated, a plot of Ecell versus Q can be made.

Graph is from https://chem.libretexts.org/Bookshelves/General_Chemistry/Map:_Chemistry...
The above graph is in the form of y =- mx +b where y-axis is E and x-axis is log Q
E = - m log Q + E°
Determine the slope of the line. m = -0.030, if we take the number of electrons transferred into account
E = E° - (0.060/n) log Q
The constant 0.060 can be interpreted in terms of energy/charge and in terms of physics constants
E = E° - (2.303RT/nF) log Q where R is the Gas constant, T is the temperature in units of Kelvin, F is Faraday's constant

The same results occur for any M/M2+ system.
This presentation also provides an opportunity for students to make connections among the macroscopic, particle level, and symbolic levels of representation (Johnstone, 1982, 1991, 1993) associated with electrochemical cells.
This presentation/lesson is consistent with the principles of Universal Design for learning in that multiple representations are incorporated in the presentation. This presentation also provides an opportunity for students to make connections among the macroscopic, particle level, and symbolic levels of representation (Johnstone, 1982, 1991, 1993) associated with electrochemical cell processes. The AACT simulation has particle level animations of what occurs at the surface of the electrodes, migration of ions in the aqueous solution, oxidation and reduction half-reactions, and migration of ions in the salt bridge.
ACS AACT computer simulation. Greenbowe, T.J.; Gelder, J.I., Boyd, A, Wixon, M. (2020). Galvanic/Voltaic Cells 2. American Association of Chemistry Teachers, American Chemical Society: Washington, D.C.
https://teachchemistry.org/classroom-resources/galvanic-voltaic-cells-2 [accessed May, 2023]
Students use an activity sheet to write net ionic equations, indicate the electron flow in the wires and metal electrode and indicated the direction of migration of cations and anions within the salt bridge.

An activity sheet for this instructional event is available from the AACT web site.
Web page author: T. Greenbowe, University of Oregon. This page is under construction.
Chemistry
In most electrochemical cells, the actual cell potential is different from the standard cell potential, E°, because the temperature of the solution and metal sree not at 1.00 atm and 25°C, and the concentrations of the ions in the solutions are not exactly 1.000 M. The (maximum) work that an electrochemical cell can do is equal to its Gibbs free energy, which for standard conditions is:
![]()
where n is the number of moles of electrons transferred in the reaction (per mole of reactant or product), F is Faraday's constant, which is the number of coulombs per mole of electrons, or 1.6022 × 10-19 C × 6.0221 × 1023/mol = 96486 C/mol, and E° is the standard cell potential. The right-hand side of this equation is the product of charge and potential, giving units of energy or work (J). For a reaction that is not in equilibrium, the Gibbs free energy is:
![]()
where Q, the reaction quotient, equals the product of the concentrations of the products, each raised to the power of its stoichiometric coefficient, divided by the product of the reactant concentrations, each raised to the power of its stoichiometric coefficient. By substituting -nFE and -nFE° into the above equation and then dividing each side by nF, the Nernst equation is obtained:

When the temperature is 298 K, using the values for R and F and multiplying by the appropriate factor to convert from base e to base 10, 2.303:

When the concentrations of both solutions are 1.00 M, under standard conditions of 25°C and a pressure of 1 atm, Q equals one, the logarithm of 1 equals zero. Under these conditions, the nonstandard cell potential, E, equals the standard cell potential, E°. When Q equals K, the equilibrium constant, that is, when the reaction proceeds until equilibrium has been reached, the second term equals the standard cell potential, and the cell potential goes to zero.
The cell potential does not depend on the how much material is in the cell (mass and volume), but does depend on the ratios of the solution concentrations raised to the appropriate stoichiometric powers. The reaction provides the energy per unit charge to an external circuit. This is a measure of how far the reaction is from equilibrium. How much material is in the cell - the concentration of ions and the mass of each electrode, are the governing factors of the total current the cell can provide.
Applying the Nernst equation to a simple electrochemical cell such as the Zn/Cu cell illustrates how the cell voltage varies as the reaction progresses and the concentrations of the dissolved ions change. The overall reaction for this voltaic cell is
Zn(s) + Cu2+(aq) -> Zn2+(aq) + Cu(s)
The reaction quotient is
Q = [Zn2+]/[Cu2+] = [2.00 M]/[0.0010M] = 2,000.
Suppose that the cell initially contains 2.0 M Cu2+ and 1.0 × 10⁻³ M Zn2+. The initial voltage measured when the cell is connected can then be calculated from Equation
Q = [Zn2+]/[Cu2+] = [2.00 M]/[0.0010M] = 0.0005
E = +1.10 Volts - (0.0592/2)log(0.0005)
E = +1.10 Volts - (0.0296)(-3.30) = +1.10 Volts + 0.097 = +1.19 Volts.
The initial voltage is greater than E° because Q is a small value less than 1.00 and the log of a number less than 1.00 is negative value. The left most term in the Nernst equation becomes a positive value and is added to the standard cell potential.
Starting with a large Cu2+ concentration and a small Zn2+ concentration, as the reaction proceeds, [Zn2+] in the anode compartment increases as the zinc electrode undergoes oxidation
Zn -> Zn2+ + 2e-
[Cu2+] in the cathode compartment decreases as Cu2+ ions in solution undergo reduction and copper metal is deposited on the electrode.
Cu2+ + 2e- -> Cu(s)
During the cell reaction, the ratio Q = [Zn2+]/[Cu2+] steadily increases, and the cell voltage therefore steadily decreases. The cell is not at equilibrium, shifting the equilibrium to the left goes toward equilibrium. Eventually, [Zn2+] = [Cu2+], so Q = 1 and Ecell = E°cell. Beyond this point, because zinc is the active metal, a reaction will still occur. [Zn2+] will continue to increase in the anode compartment, and [Cu2+] will continue to decrease in the cathode compartment. The value of Q will increase further, leading to a continuing decrease in Ecell.
[Graph of E vs Q inserted here]
Cell potential of the zinc-copper cell as a function of the concentration ratio [Zn2+]/Cu2+] at 25°C.
When the concentrations in the two compartments are the opposite of the initial concentrations (i.e., 2.0 M Zn2+ and 1.0 × 10⁻⁴ M Cu2+), Q = 1.0 × 10⁴, and the cell potential will be reduced to +1.00 V. A plot of Ecell versus log Q reveals a linear relationship.

Graph is from https://chem.libretexts.org/Bookshelves/General_Chemistry/Map:_Chemistry...
1. Cell potentials are obtained by adding individual reduction potentials
2. Anodes, like anions, are always negatively charged and release electrons, and cathodes, like cations, are always positively charged and attract electrons.
3. The anode is positively charged because it has lost electrons. The cathode is negatively charged because it has gained electrons.
4. Electrons flow through the salt bridge and the electrolyte solutions to complete the circuit,
Learning ObjectivesReferences
Abraham, M.; Gelder, J.; Greenbowe, T. (2007). During Class Inventions and Computer Lab Activities for First and Second Semester General Chemistry. Hayden-McNeil: Plymouth, MI.
Cole, M. H., Fuller, D. K., & Sanger, M. J. (2021). Does the way charges and transferred electrons are depicted in an oxidation–reduction animation affect students’ explanations? Chemistry Education Research and Practice, 22(1), 77–92.
de Jong O. and Treagust D. F., (2002), The teaching and learning of electrochemistry, in Gilbert J. G., de Jong O., Justi R., Treagust D. F. and van Driel J. H. (eds.), Chemical education: towards research based practicale, Dordrecht: Kluwer, pp. 317-338.
Johnstone, A.H. (1993). "The development of chemistry teaching: A changing response to changing demand. " Journal of Chemical Education, 70(9), 701-705.
Langford, C.H. and Beebe, R.A. (1969). The development of chemical principals. Dover Publications, NY.
Greenbowe, T.J. (1994). "An interactive multimedia software program for exploring electrochemical celIs." Journal of Chemical Education, 71(7), 555.
Greenbowe, T.J.; Gelder, J.I., Boyd, A, Wixon, M. (2020). Galvanic/Voltaic Cells 1. American Chemical Society, American Association of Chemistry Teachers, Washington, D.C. https://teachchemistry.org/classroom-resources/voltaic-cells
Sanger, M.J. and Greenbowe, T.J. (1997). “Student Misconceptions in Electrochemistry: Current Flow in Electrolyte Solutions and the Salt Bridge.” Journal of Chemical Education, 74(7), 819-823.
Sanger, M. J. and Greenbowe, T.J. (1997). “Common Student Misconceptions in Electrochemistry: Galvanic, Electrolytic, and Concentration Cells.” Journal of Research in Science Teaching, 34(4), 377-398.
Sanger, M.J. and Greenbowe, T.J. (1999). “An Analysis of College of Chemistry Textbooks as Sources of Misconception and Errors in Electrochemistry.” Journal of Chemical Education, 76(6), 853-860.
Sanger, M. J.; Greenbowe, T. J; Addressing student misconceptions concerning electron flow in aqueous solutions with instruction including computer animations and conceptual change strategies. International journal of science education, 2000, Vol.22 (5), p.521-537.
